Upgrading my T490 to 1080p
A while back I decided I needed (yes, needed) another laptop. I do have a Thinkpad T450s already but my daughter has pretty much taken it completely and uses it for school work. So I went on the hunt for a new one. I wanted it to have USB-C so that I could use my existing dock and setup at home that I have from working at home with my work laptop.
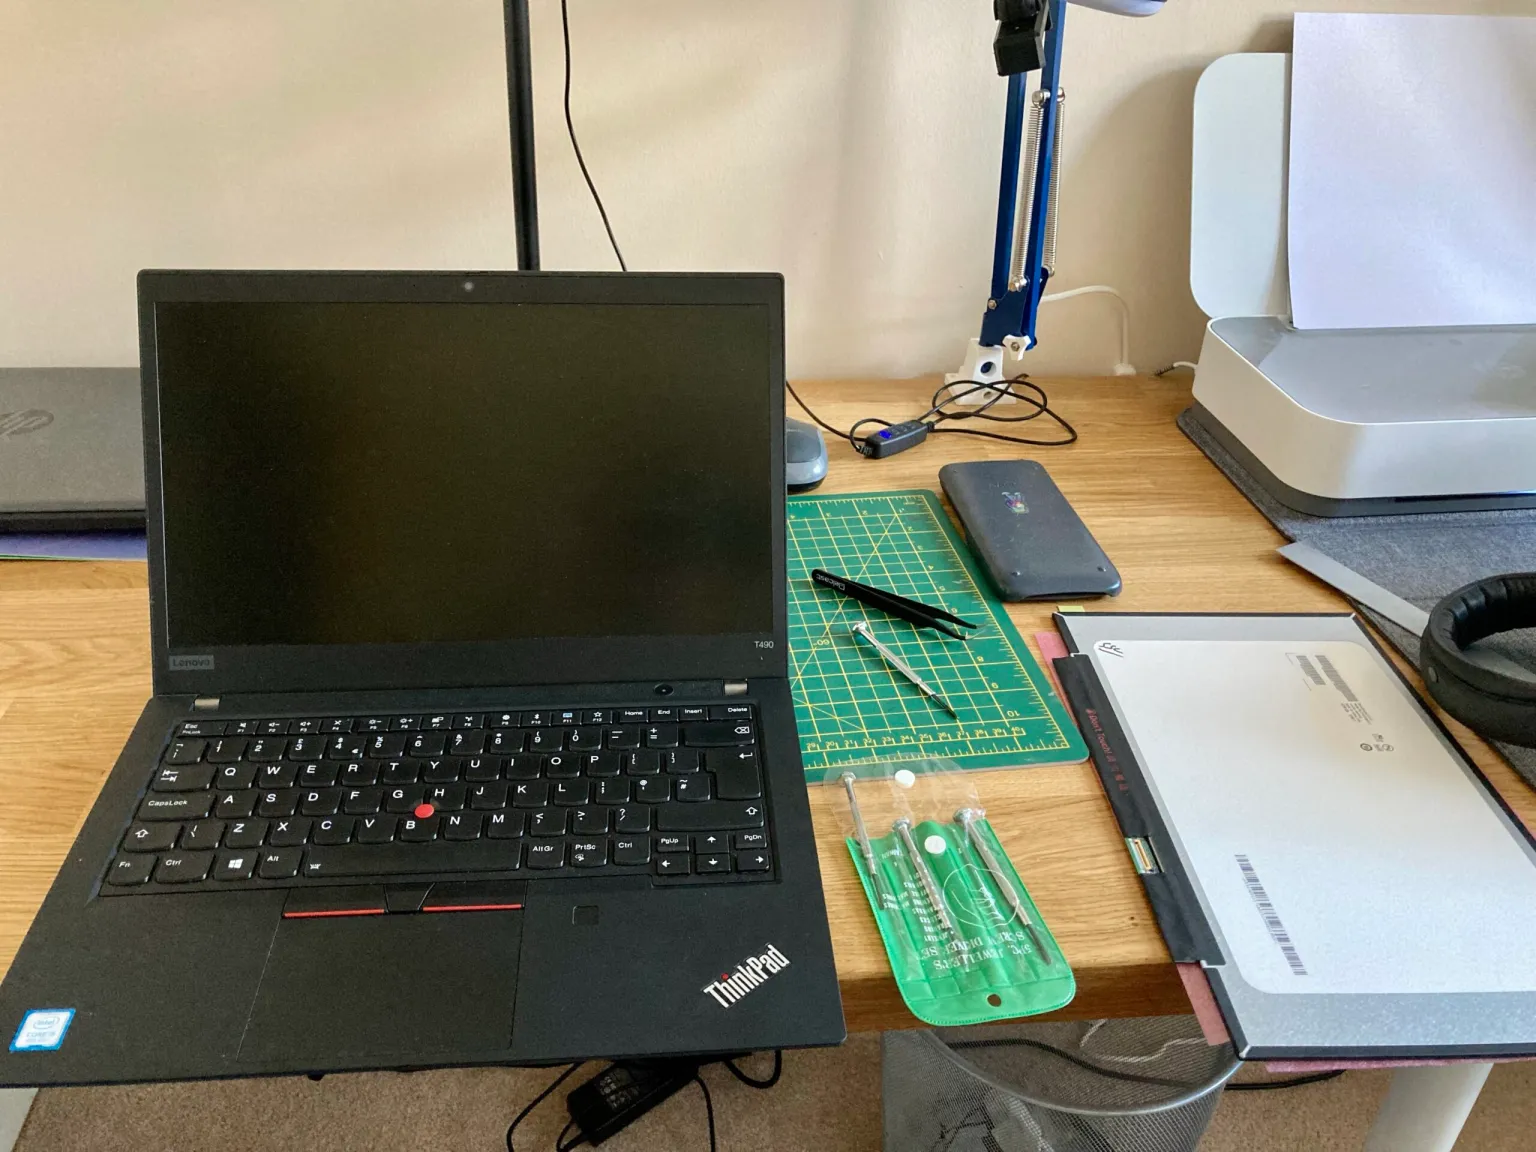 Prepare the work area
I started trying to figure out which model was the oldest I could get, but then saw that I should try and find one with the 8th intel cpu (or higher) as these were the low powered quad core CPUs which had a much bigger performance boost compared to previous generational increases. This meant T490(s) or 6th gen X1 Carbon (2018). It was pretty easy to find out that the T490 was the cheapest, and offered the most ports and expandability.
I found a bargain on eBay but lo-and-behold the screen was a horrible 1366×768. I thought they stopped selling laptops with such dire screens. But no, and in fact you can still get models with them today from Lenovo. I later rechecked the listing and it conveniently didn’t specify anything about the screen resolution.
I had the choice of sending it back and buying a new one, (or sending it back and not getting another as why do I need six computers in the house), living with it, or upgrading the screen. I did upgrade the screen of my X230 about 5 years ago and that was pretty easy. It looked like buying a replacement screen would be the cheapest. Especially if I can sell the old screen to recoup some money.
Finding the right model to get was pretty straight forward. A quick visit to /r/thinkpad and searching for screen replacement so led to finding out which model is best to get. There’s also this review of screens by notebookcheck. Supposedly it’s the Innolux N140HCG-GQ2, and this is what I bought from an interestingly named store of Softhands.co.uk. I’ve just noticed there’s a B1 version but don’t know if it’s better.
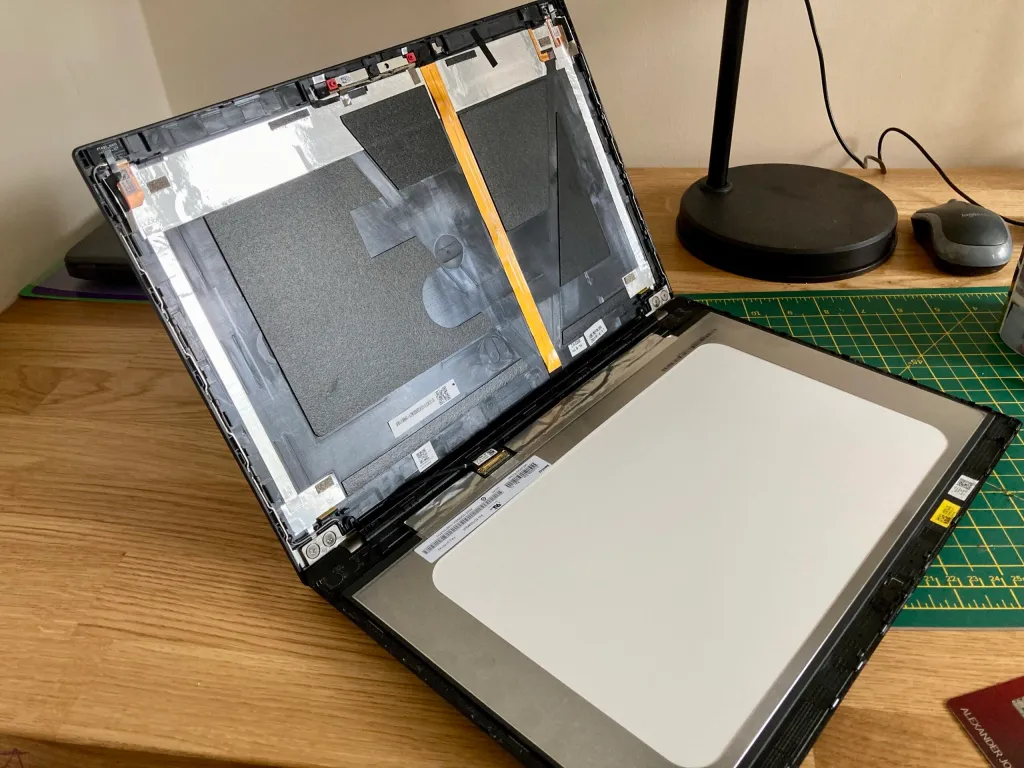 Plastic clips and a bit of stick is all the keeps the screen attached
 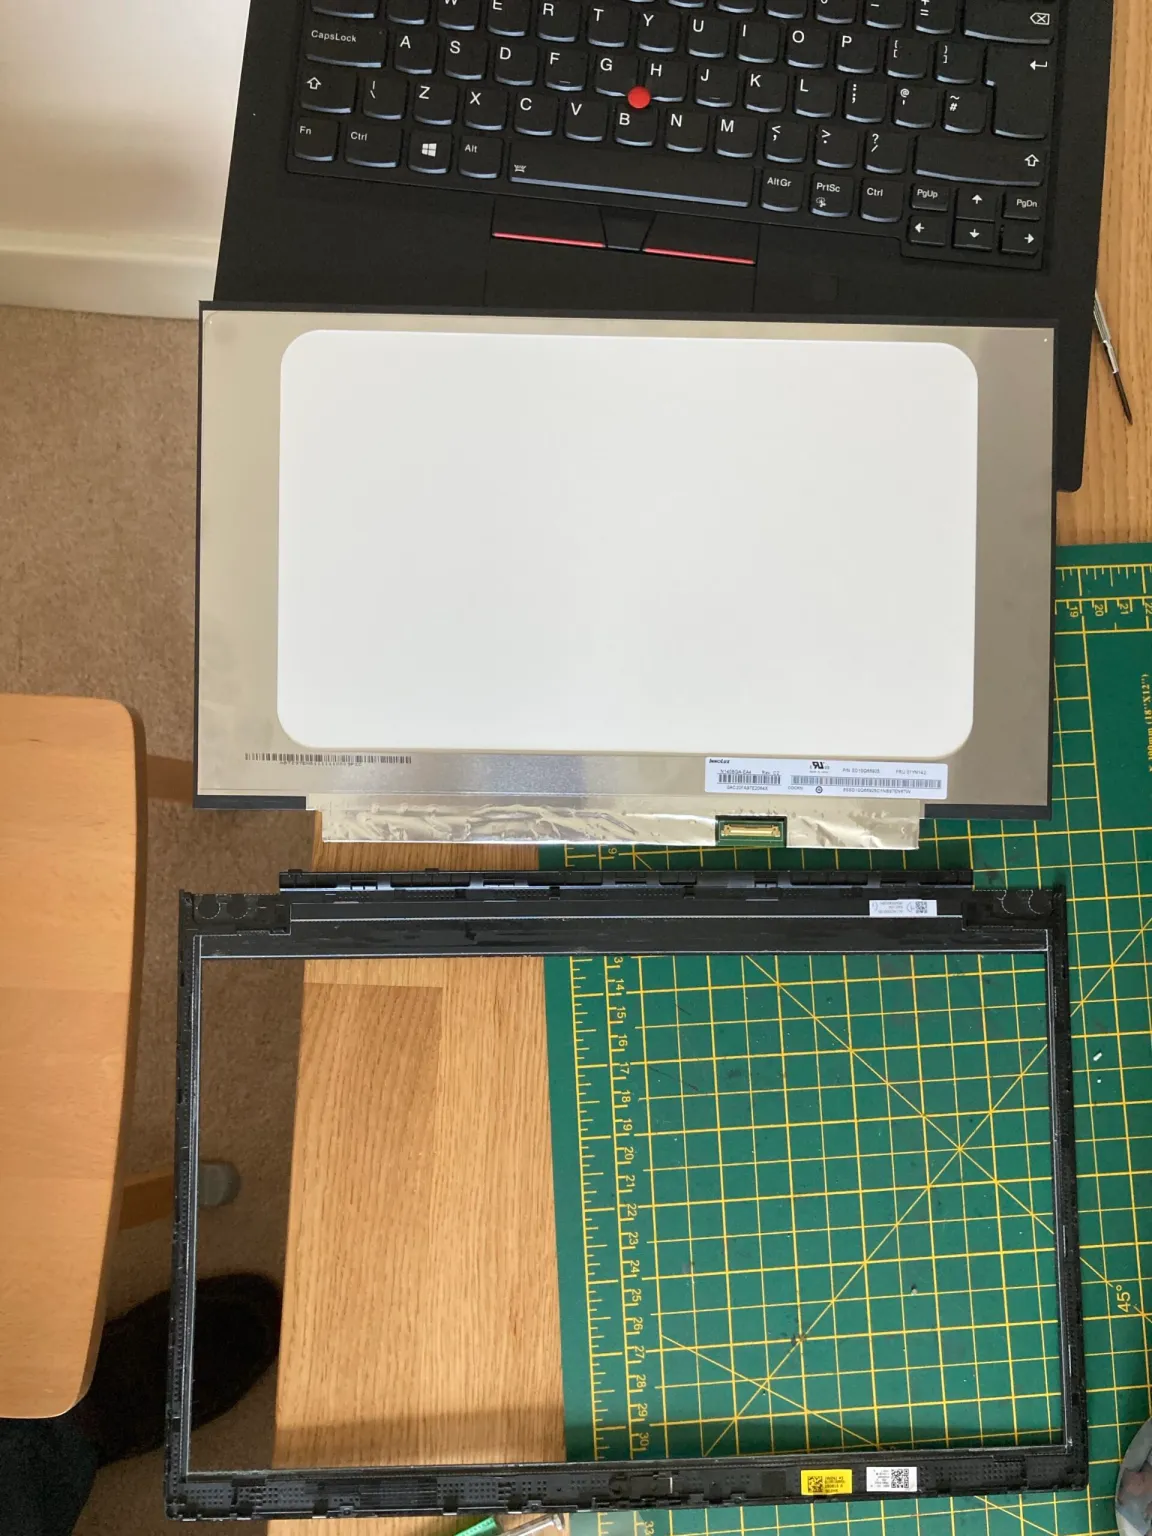 More sticky holds the bezel and screen together
 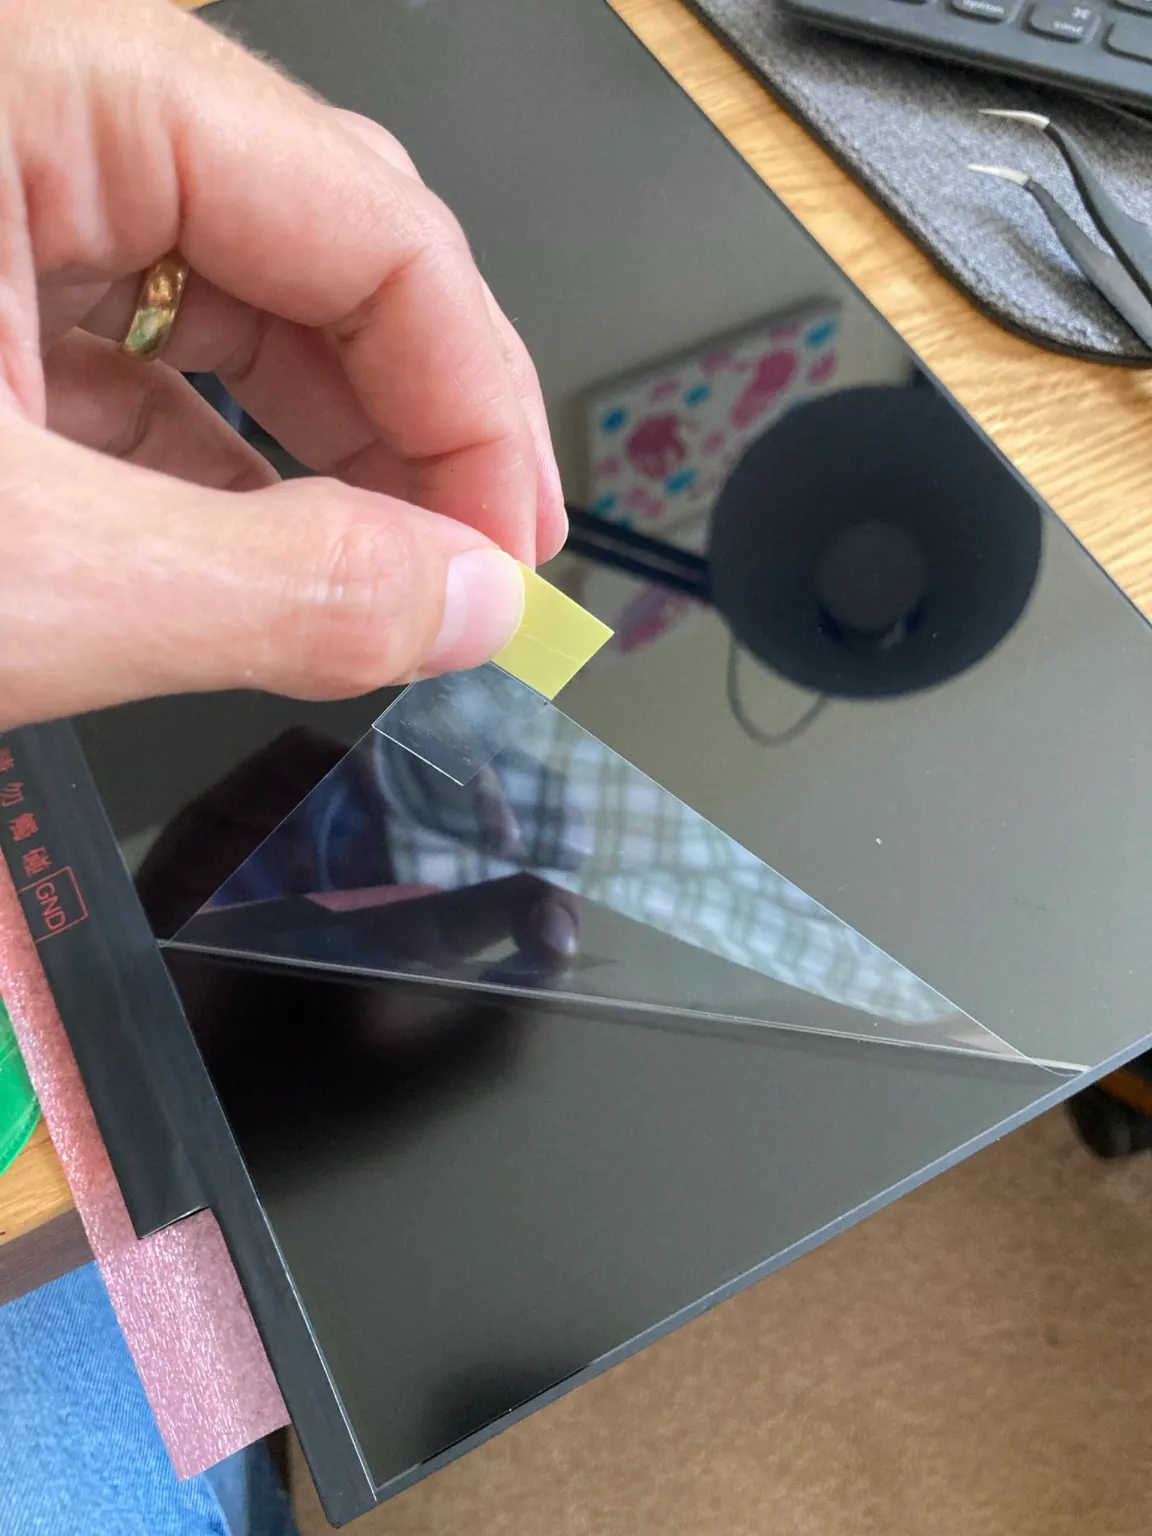 The best part
There are a couple of videos on YouTube showing you how to do it, and even some videos by Lenovo. Like all ThinkPads there’s the service manual which has a lot of good information for any upgrade or repair you might want to me.
I used a small screw driver to start separating the bezel from the lid and then a metal credit card to separate it further. There are a few sticky parts that need pulling apart. You need to apply more force than you think to get it to separate.
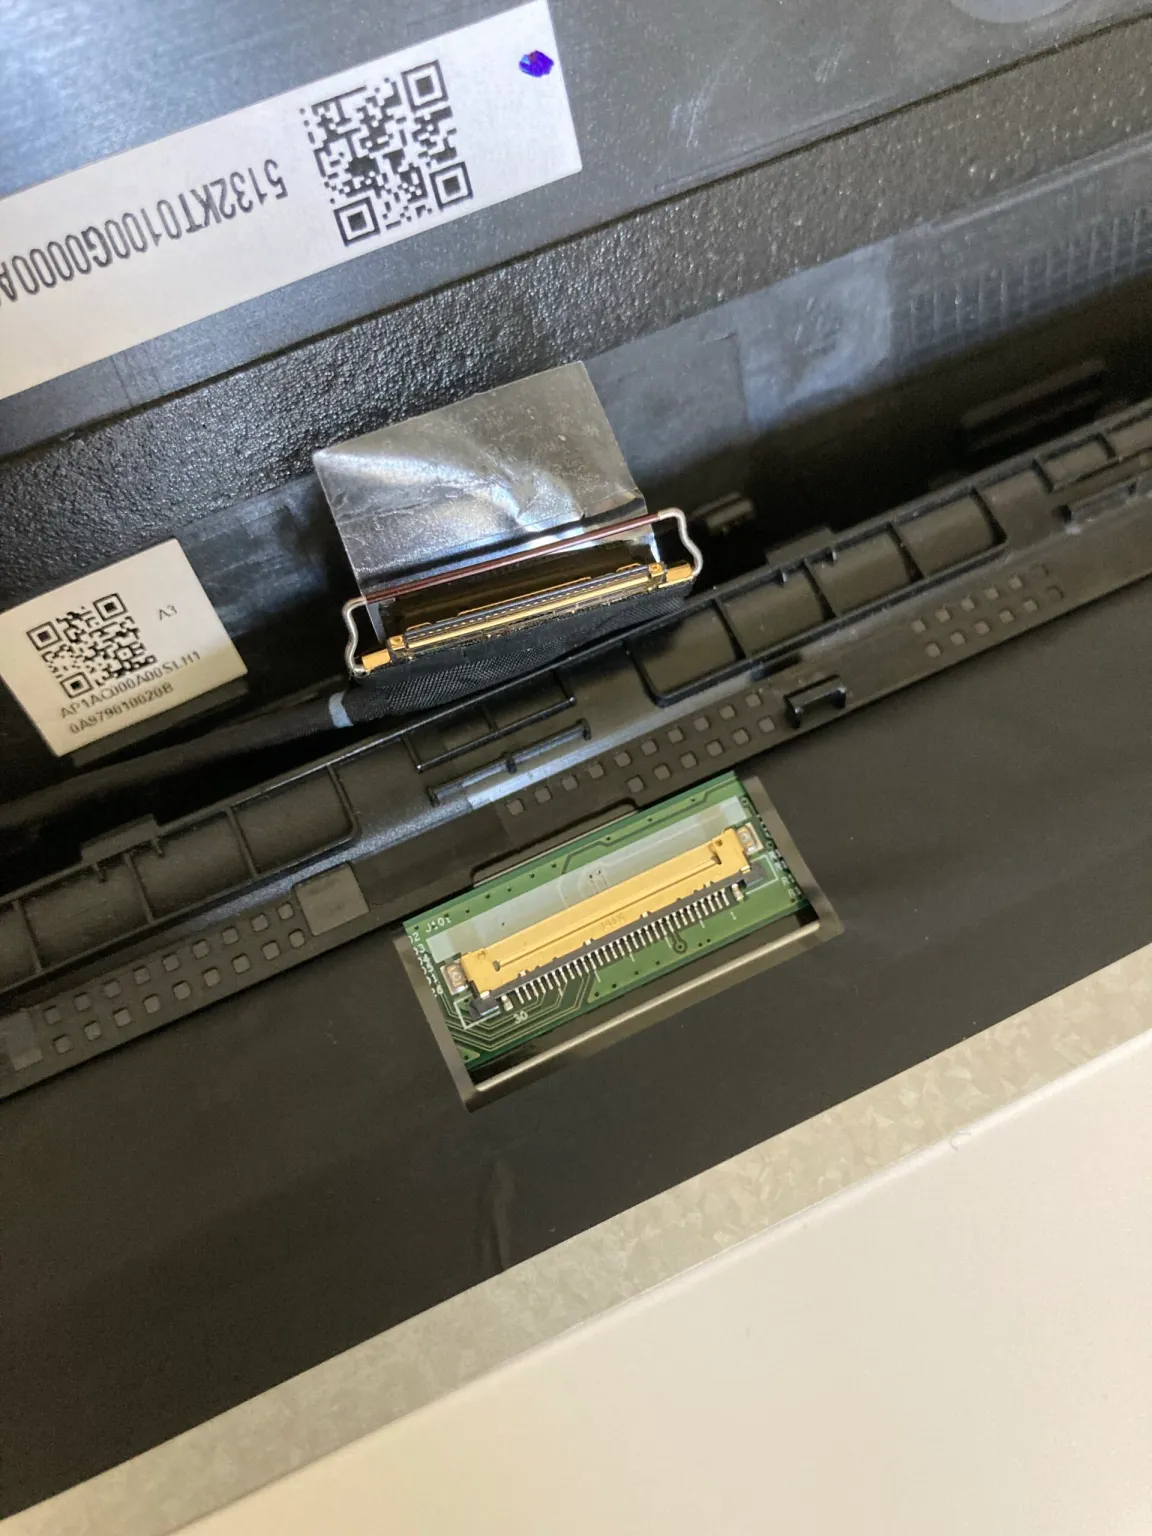 Screen connector
Detaching the cable is the fiddliest part. There’s a catch to lift up and over and then the connector slides out parallel to the main board towards the lid. I have some pointy nose tweezers that helped with this part. Getting this back in when reassembling is equally fiddly and you need to make sure it goes all the way in so that the two parts are flush together.
The first boot and the Lenovo logo appeared but then it all went blank. Oh uh! I restarted and went into the BIOS — the screen was working fine again — poked about in the settings but there wasn’t anything to do regarding the screen so I restarted and, Success! Windows booted and I could change the resolution to 1920×1080. 🎉
There is a balance between screen area, resolution and pixel density. I find native 1080p a good balance between them on a 14” screen. A higher resolution and everything gets too small to read. You can up the scaling but then you start to lose space, also I find non-integer scaling, such as 1.5 or 150%, can sometimes lead to funny text or other UI annoyances. It’s been a while since I tried, so I’m sure OSs have improved this. You can avoid this by going with a 4K screen and doing 200% scaling, and it looks lovely, probably also because the panel has full colours and great brightness.
So if you have a low resolution screen, I’d definitely encourage you to look into replacing it yourself. Now I’m off to install Linux on it! 🐧
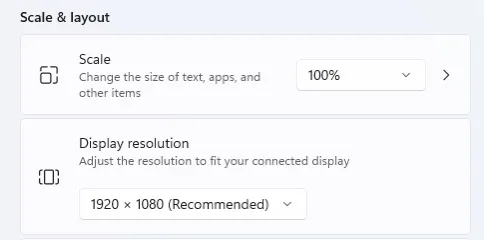 This is what you want to see
I’m having fun playing Dark Forest - the 277DAO community round this weekend. I tell myself “just one more move” but then it’s 2 hours later 😵
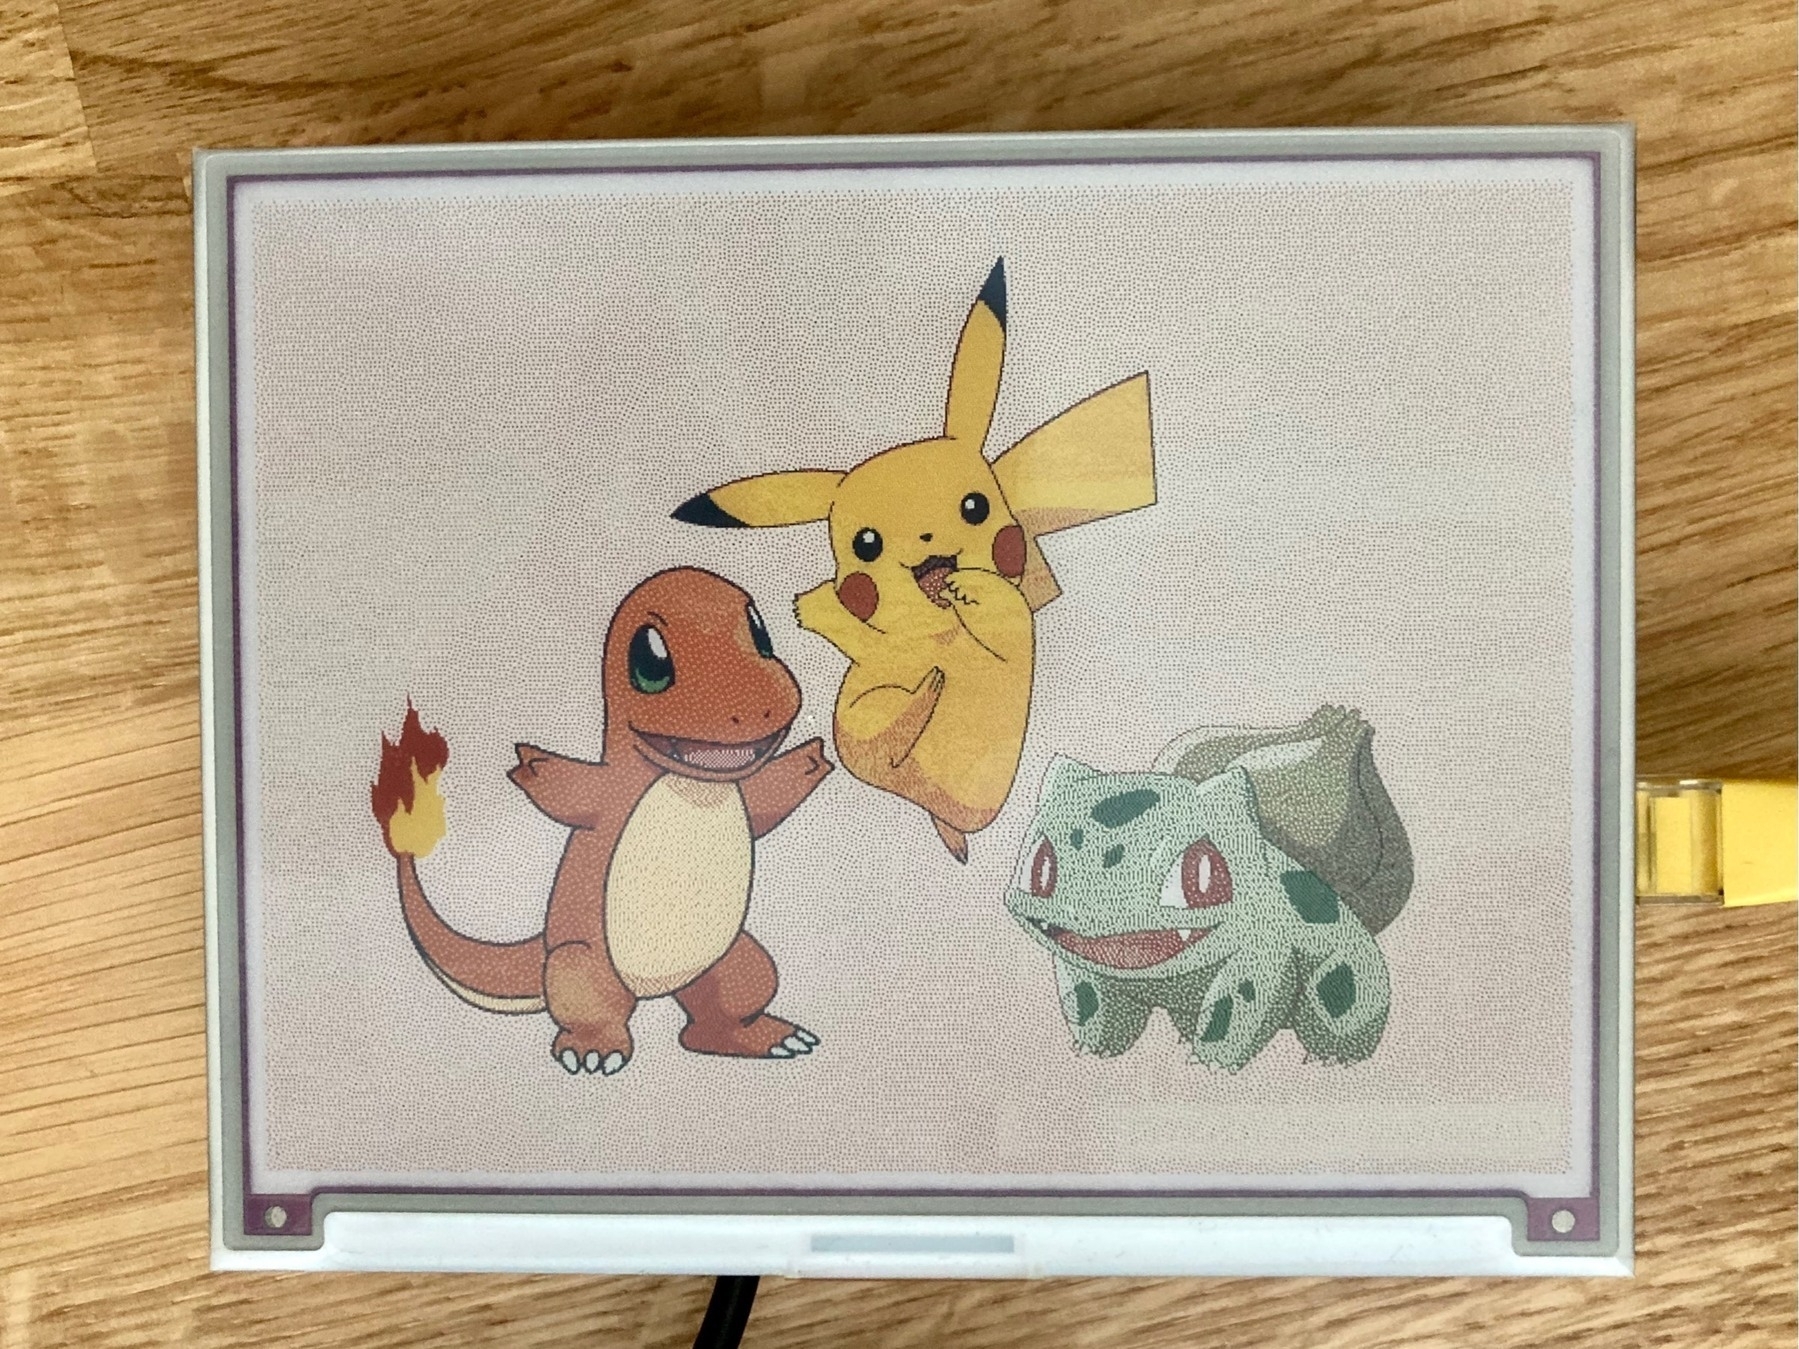
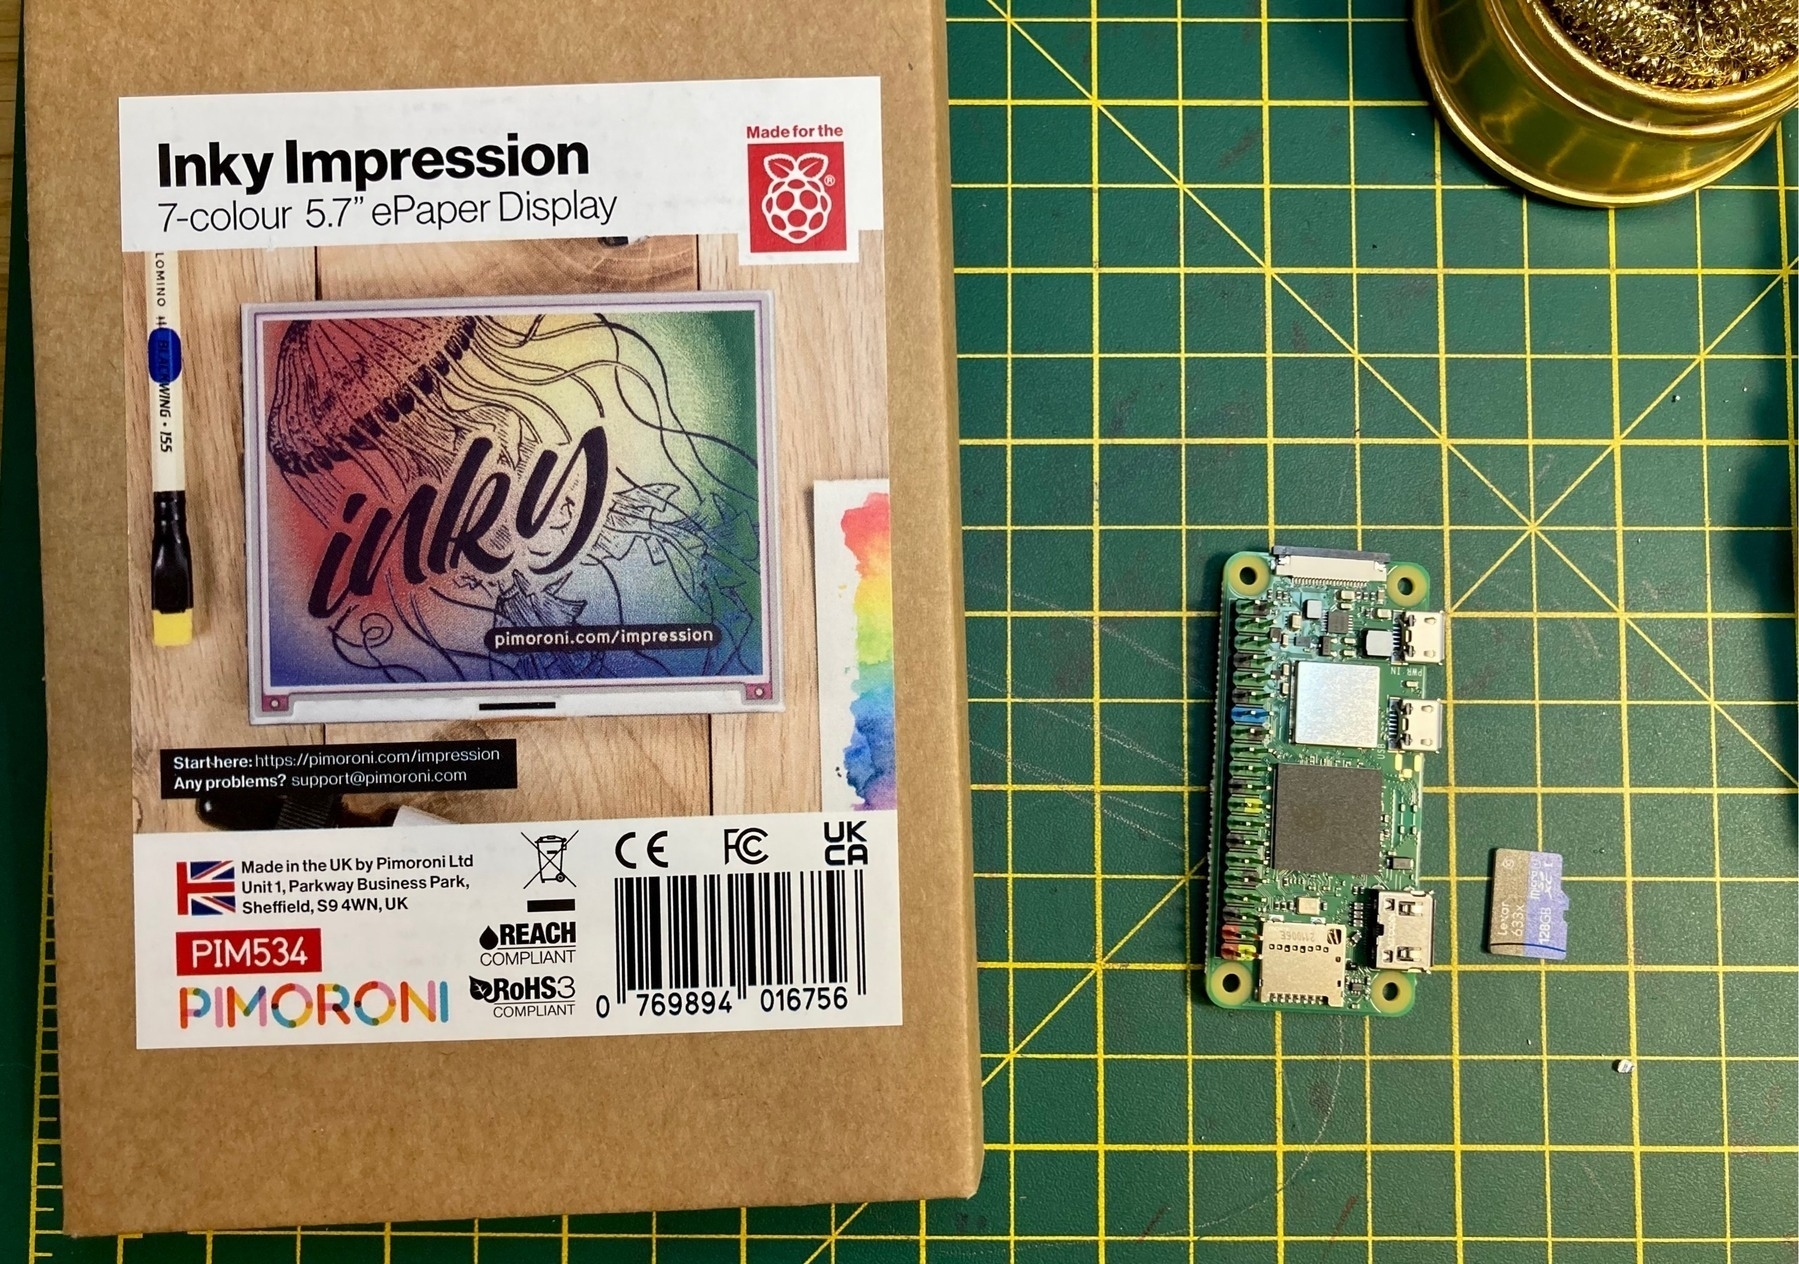
E-ink success! Now to see if I can fix the dodgy soldering job so the pi zero (with wifi) will work.
It’s only taken 5 months but I’m starting!
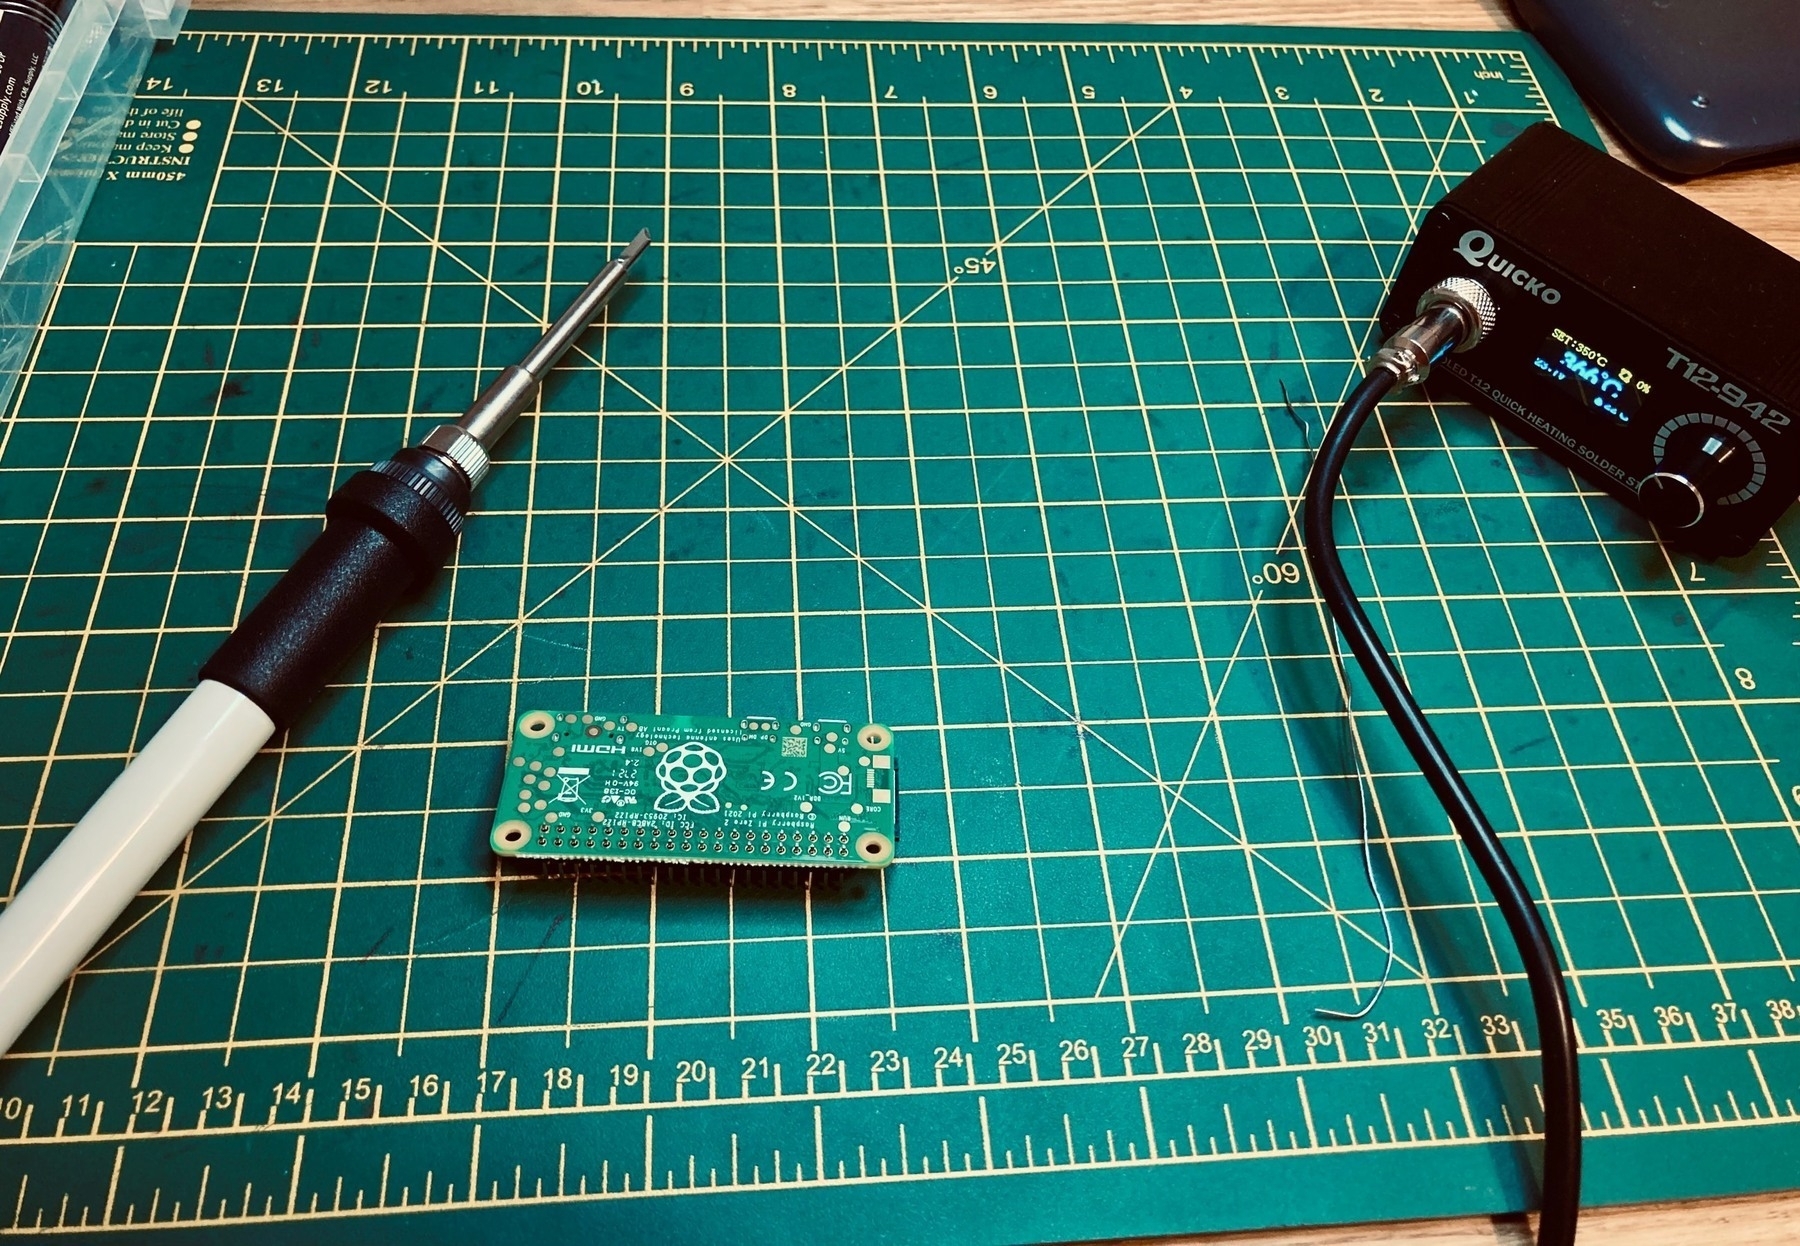
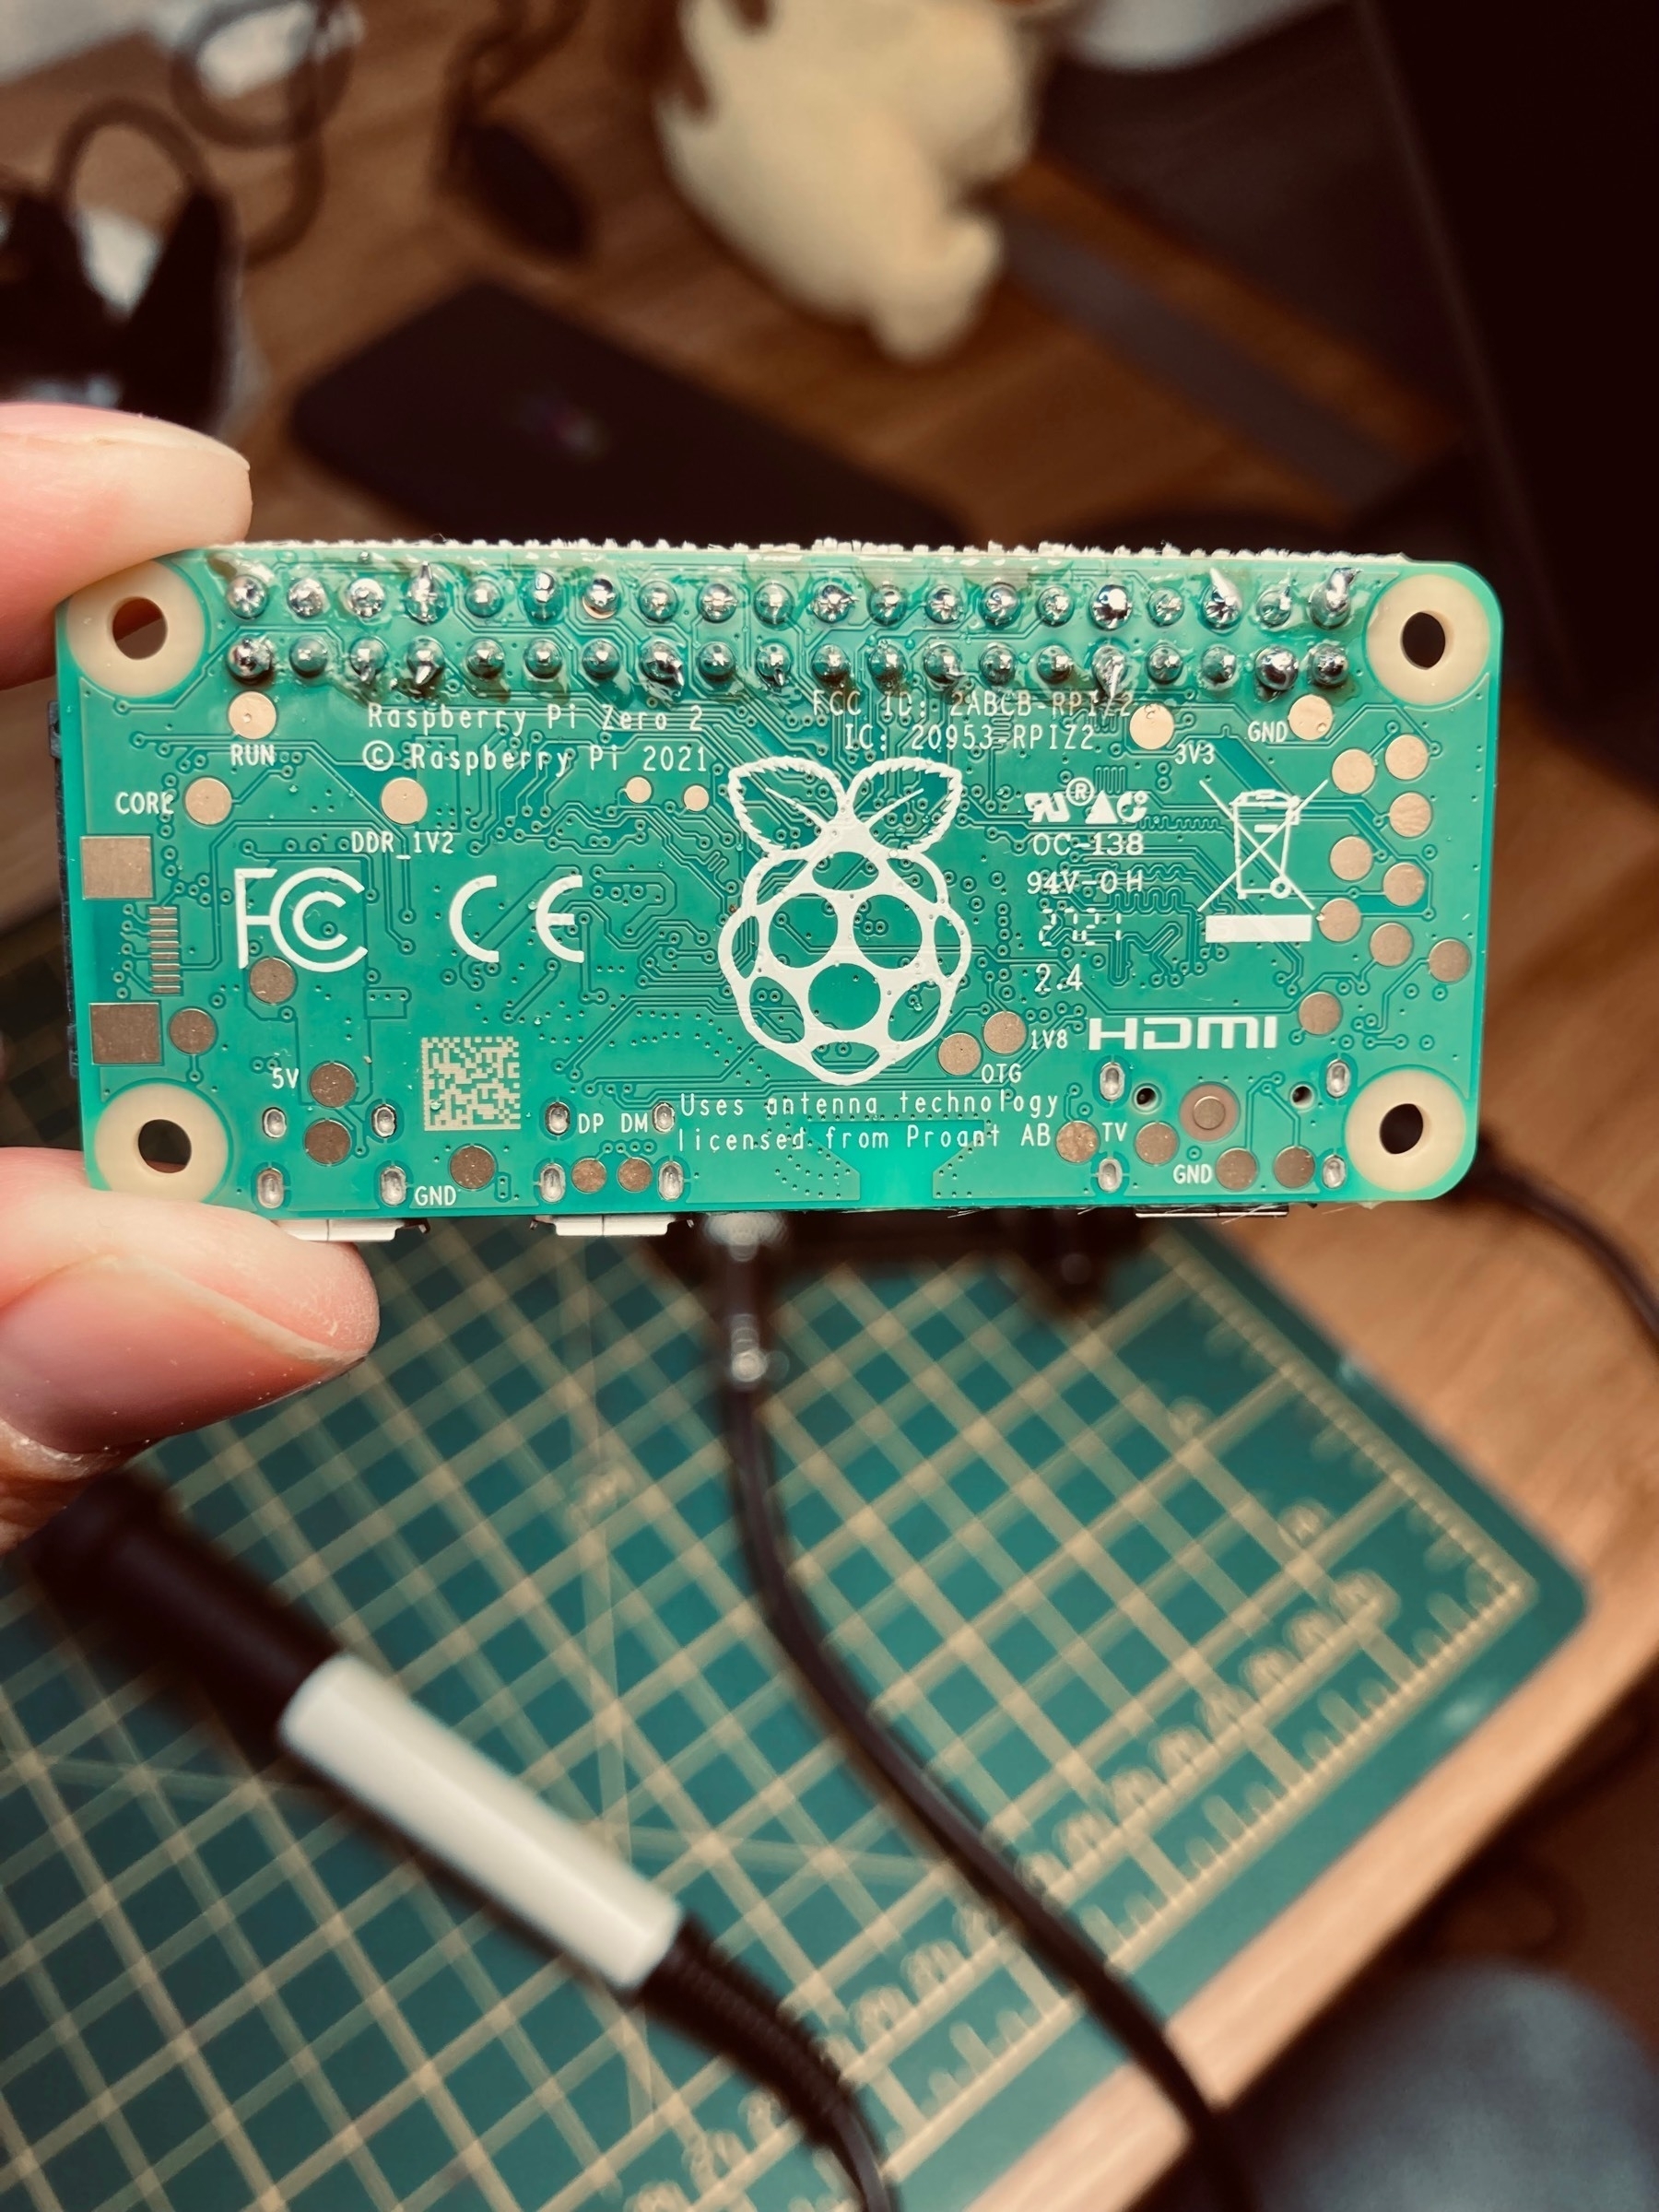
The Pi Zero 2 doesn’t come with GPIO pins so I had to solder the header. Not a bad attempt. One pin did pop out later on.
The hardware part wasn’t very hard! Next stage is installing the software then figuring out what I’m doing with this thing! 🖼🧑💻
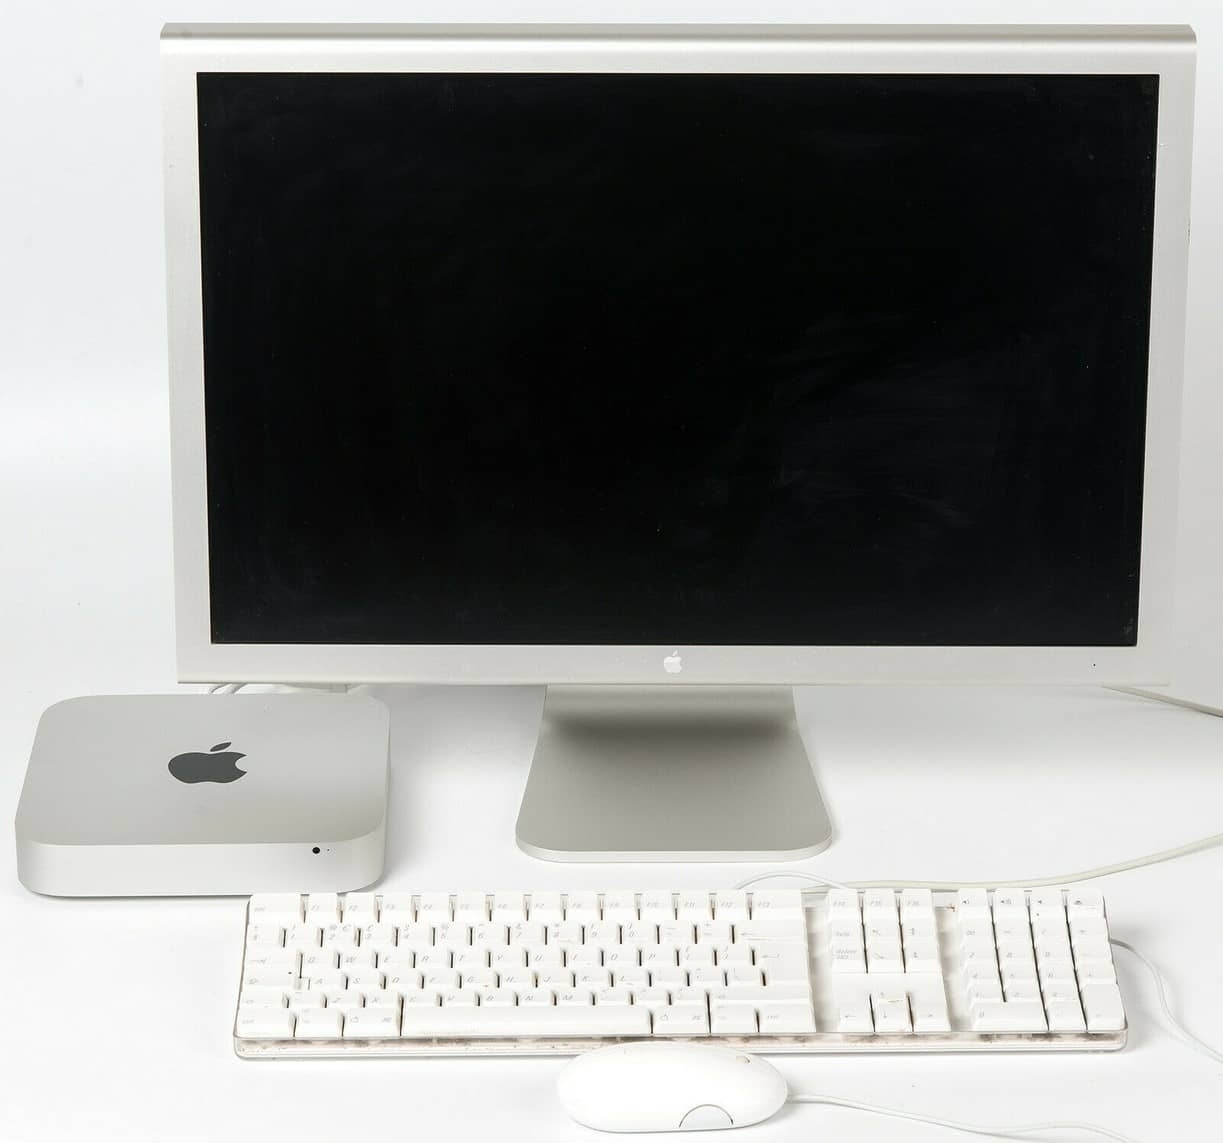
My cheap, old 2012 mac mini seems to struggle with the 50,000+ Photos library. I don’t want to buy a new one as the current 2 TB SSD will be pricey to replicate in the M1 version!
Enjoyed staying at the Ceilidh Place in Ullapool this weekend. I could retire to this place.

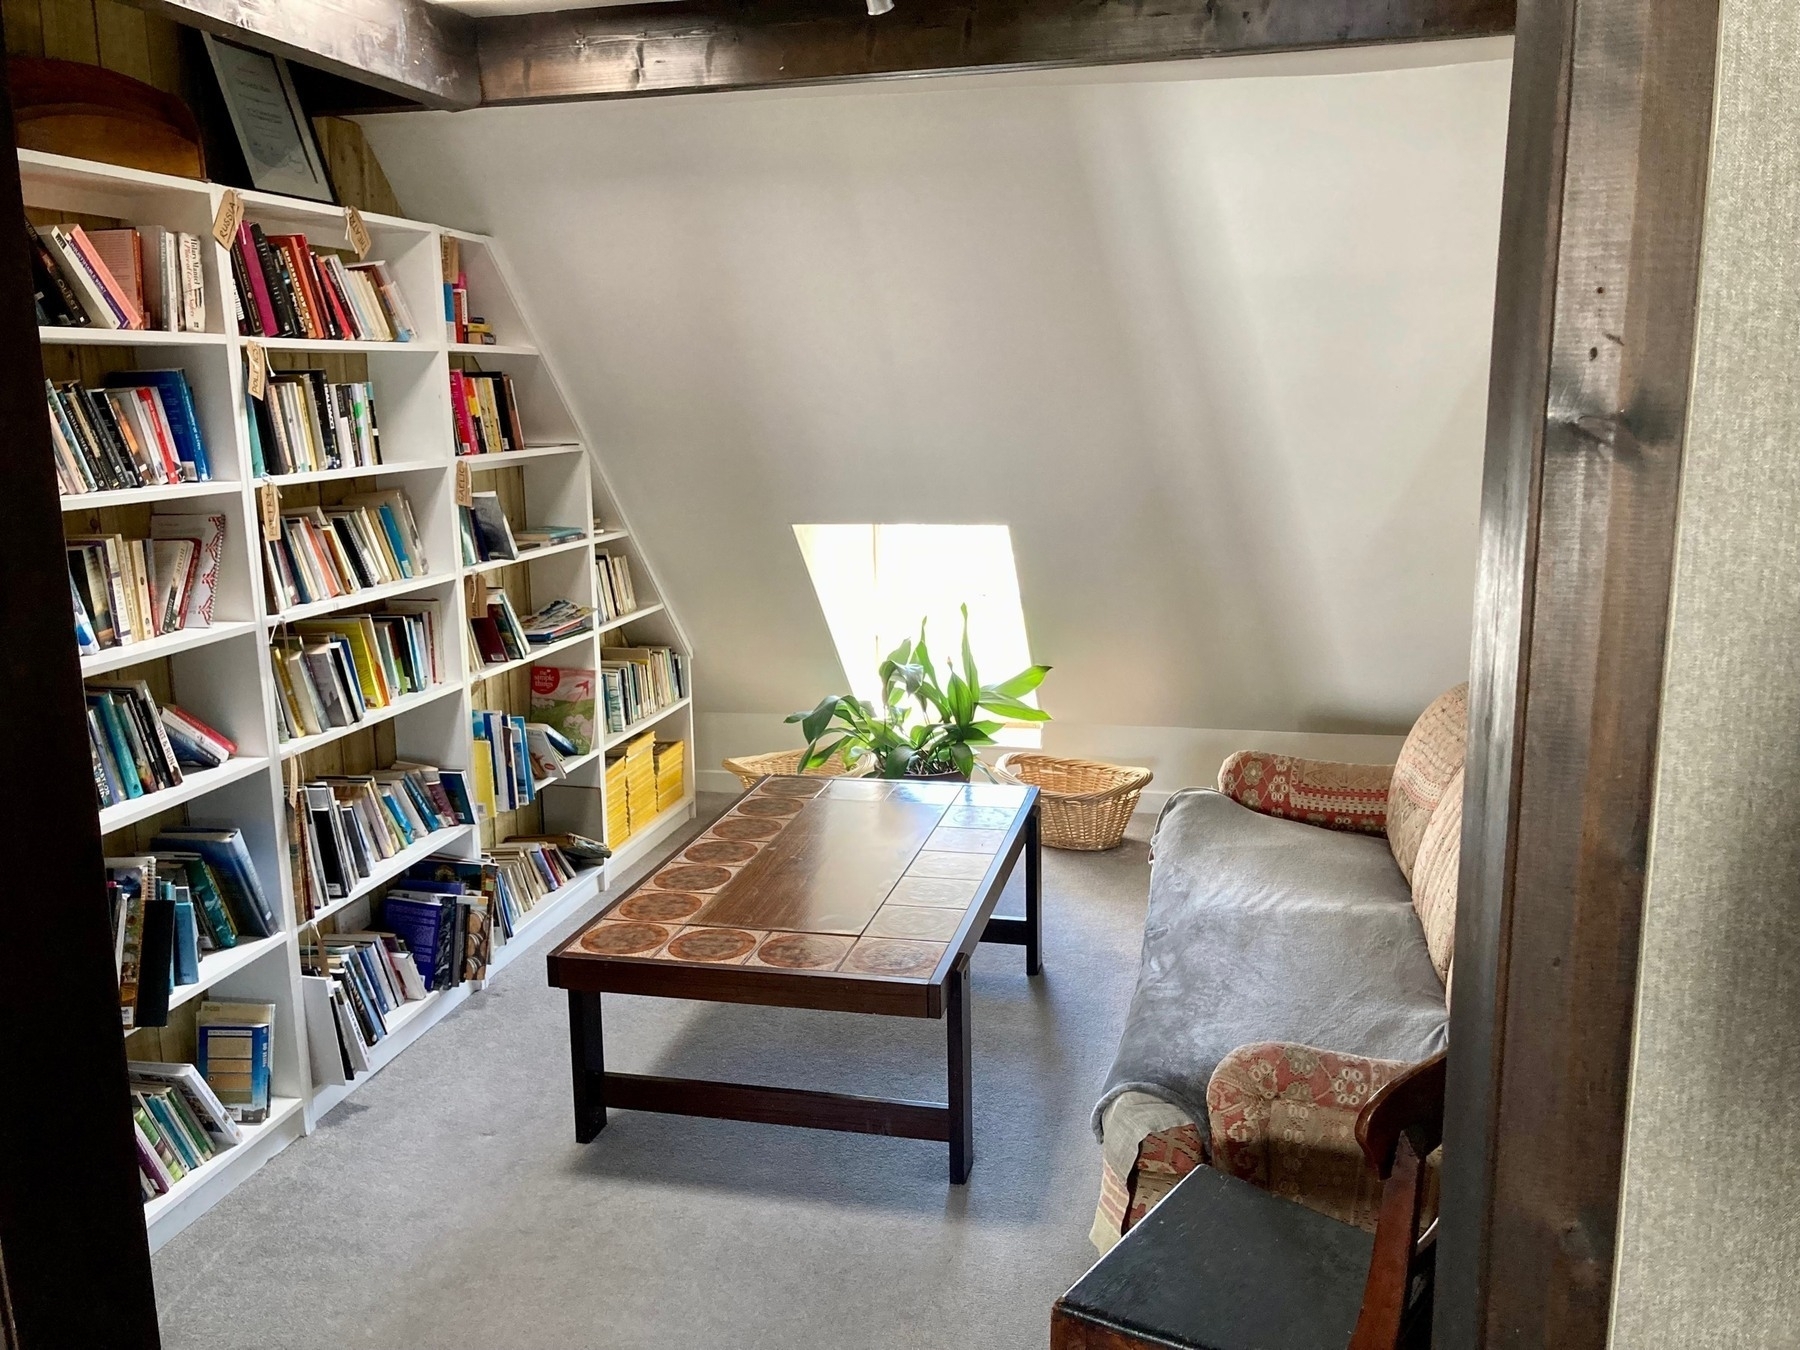
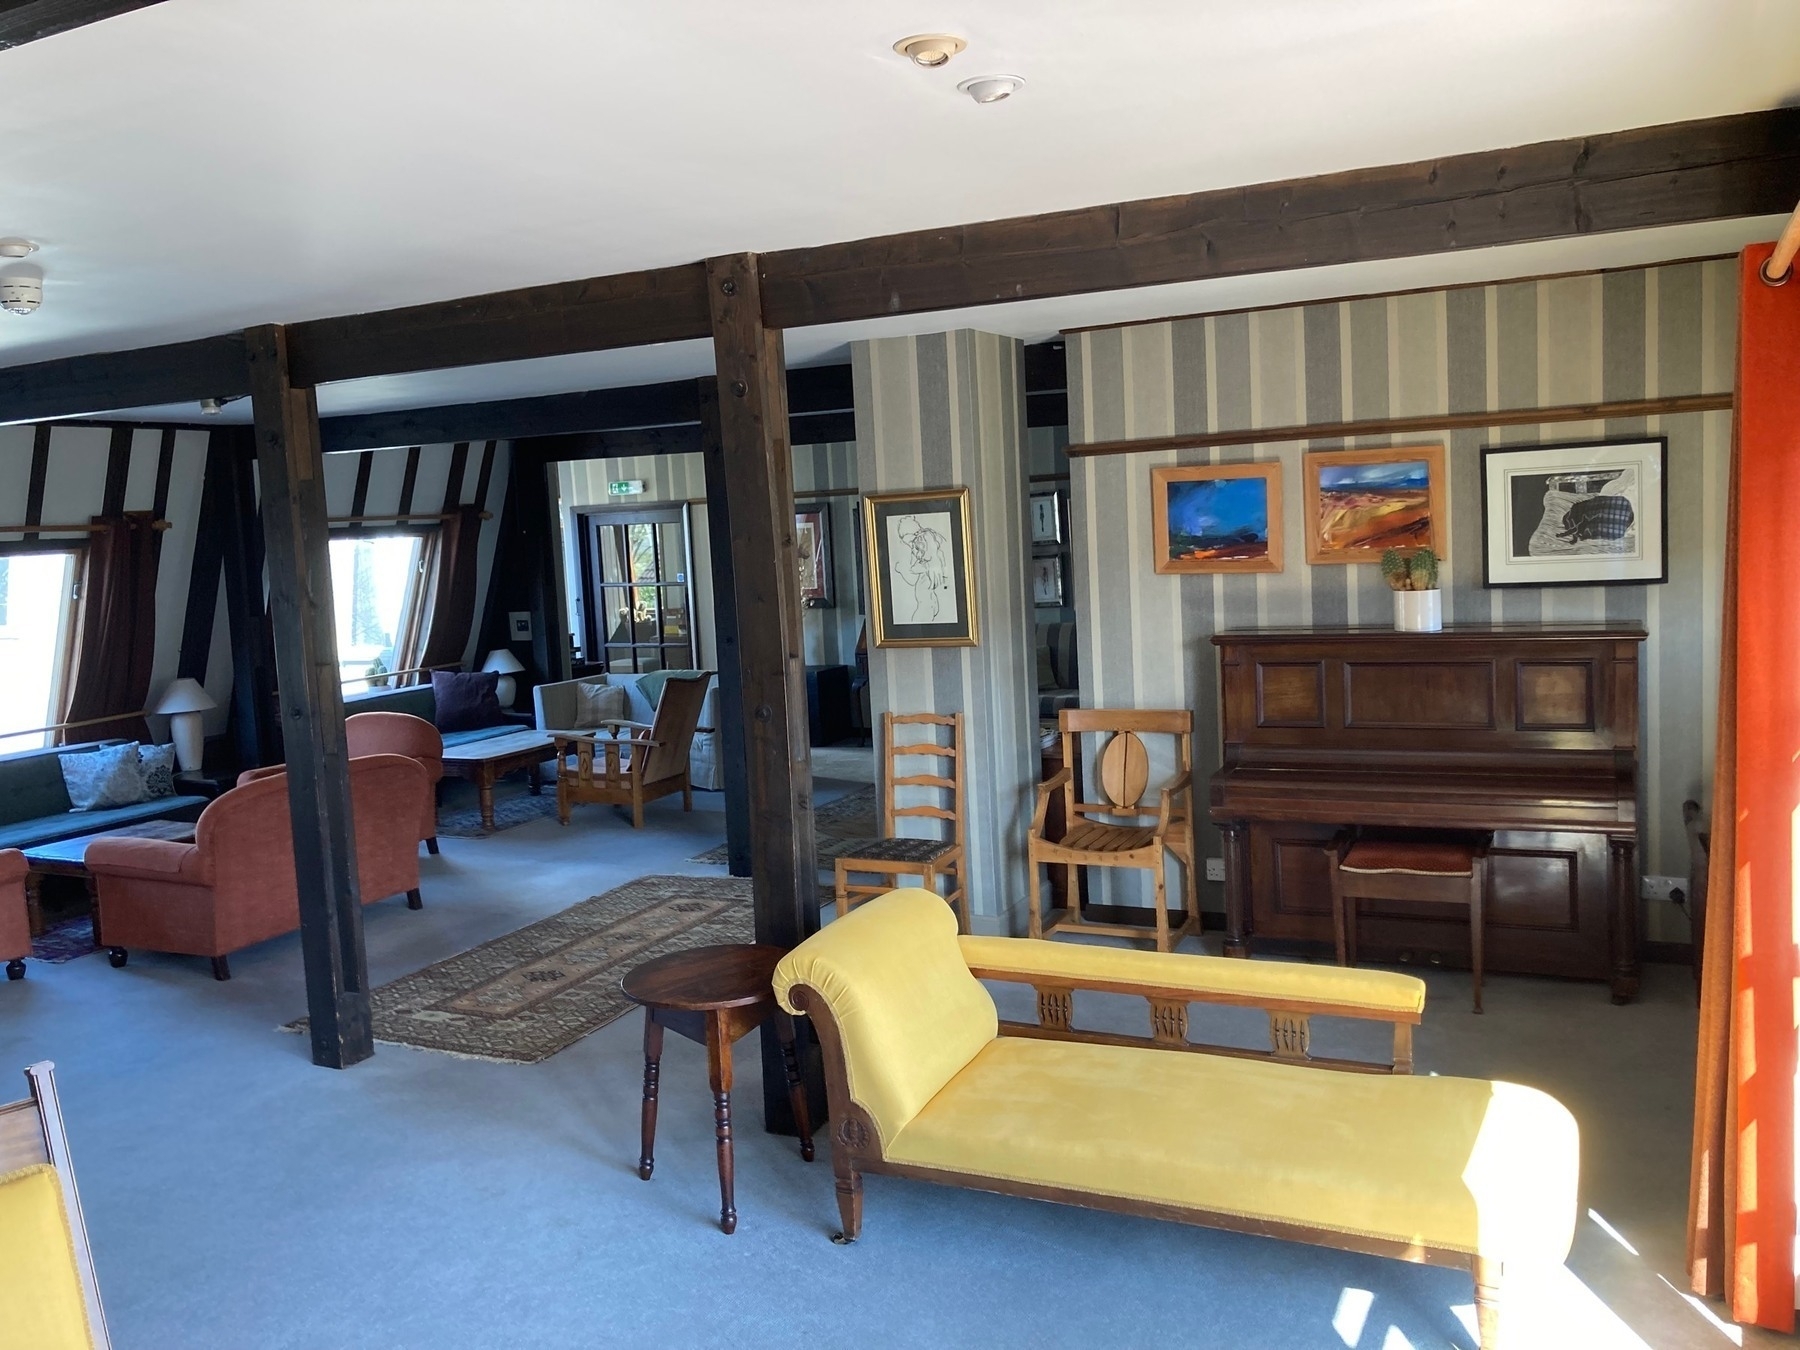
The local scenery is incredible.

Generating lots of tiddlers
For my Meditations Tiddlywiki, I wanted to make each statement an individual tiddler. Whilst it doesn’t add a great deal to the site right now (beyond just viewing the minimum amount, the random tiddler button, and following the tiddlywiki mantra), I think it’ll be useful later on. Over time I’d like to add my own thoughts or interpretations to them, or maybe categorise favourite ones with new tags. Plus they might be useful for other people who can export tiddlers or download the file.
I had the site previously but it was one tiddler per book, and that didn’t make it very usable beyond just reading.
I find the easiest way to import lots of tiddlers is via a JSON file. Luckily I’d found a JSON file of Meditations some time ago. It’s easy to find the text but that’s not always as easily parsed as as structured document. The JSON was just book and then each line. I still needed to get the title, tags, and fields sorted out before I could import into a blank Tiddlywiki.
The general structure of JSON to be imported looks like this:
[
    {
        "created": "20211215114254021",
        "text": "More content",
        "tags": "Home [[Book 1]]",
        "title": "2nd tiddler",
        "modified": "20211215114322673",
        "book": "3",
        "section": "12"
    },
    {
        "created": "20211215112427768",
        "text": "Content",
        "tags": "Home",
        "title": "Meditations",
        "modified": "20211215112535190",
        "section": "1",
        "book": "2"
    }
]
The section and book are fields I added and the rest should be obvious. Tags with spaces need to be in [[ ]]. So all I’d need to do is iterate over the JSON file and create new entries that matched this structure.
The first issue I came across was knowing how many sections per book there are. I made a new list of the number of sections and stored that in the meditations.json file. Whilst not necessary (as I could’ve used the code to generate this later on), I thought it might be helpful and more efficient to compute it once and store the results. data is the json file as you’ll see shortly.
sectionCount = [len(data["meditations"][f"{x}"]) for x in range(1,13)]
So now that I have everything it was just a case of building the list in the format I wanted and writing it to a file. Here’s the code:
import json

with open("meditations.json", "r") as read_file:
    data = json.load(read_file)

book_names = [
    "Book I",
    "Book II",
    "Book III",
    "Book IV",
    "Book V",
    "Book VI",
    "Book VII",
    "Book VIII",
    "Book IX",
    "Book X",
    "Book XI",
    "Book XII",
    ]

result = []

for book in range(12):
    for section in range(data["sectionCount"][book]):
        book_name = book_names[book]
        title = f"{book_name} - Section {section + 1}"
        tags = f"[[{book_name}]]"
        quote = data['meditations'][f"{book + 1}"][section]

        # Create each tiddler
        entry = dict()
        entry["created"] = "-01800000000000000"  # that's 180BC
        entry["text"] = quote
        entry["tags"] = tags
        entry["title"] = title
        entry["section"] = f"{section + 1}"
        entry["book"] = f"{book + 1}"

        result.append(entry)

# Write to json file
with open("tw_data.json", "w") as write_file:
    json.dump(result, write_file)
I started going down the route of converting the book number to roman numerals but given the one off nature of this I just made a list of the names I wanted for the books. 😅
I then just imported into a blank Tiddlywiki, made a few other pages and a table of contents macro tiddler and it’s good to go!
What could go wrong.
Monte Carlo Simulation in Excel with Python
There are quite a few blogs that show you how to do Monte Carlo simulations using python. A very accessible one is from Practical Business Python. Always a great site for python in the workplace for non-devs. However, I couldn’t find one that did just what I wanted, namely, take a model I’d already built in Excel and then apply some randomness and plot the S-curve (cumulative distribution function).
Maybe if I’d searched more I’d find one but instead I just got on with it. I also used to have some software at work that did this for me, it was an add-on to Excel but work stopped paying for it and I found it hard to justify it (it’s an Oracle product so no doubt pricey). Plus I always love an excuse to try and learn a bit more python.
Background
If you don’t know, Monte Carlo simulation is a way to capture uncertainity. If a friend is driving to your house, 50 miles away, and they travel at 50 mph it’ll take then one hour right? Well, not always. Maybe they are keen on the gas and drive faster, or maybe there’s an accident and they get stuck. You just never know. So you could use monte carlo to say that their average journey speed could be from 40-60 mph, then you randomly sample many many times from that range and work out the time it takes. Do it 10,000 times and you then have 10,000 results that you can draw estimates from, e.g. the average time. You can also plot the results and show the whole range.
Tools
The main python tools to get this working is numpy for the random sampling and xlwings for interacting with Excel. Like all python libraries, these tools do way more than just what I need. I also used pandas, seaborn and matplotlib. Probably unnecessary but they’re quick to work with as I already know the gist of them.
Then of course there’s Excel, which needs no introduction. I’d already built my deterministic model in Excel, where all my inputs were in one table that could be changed and then the outputs were in another to be read.
There’s always going to be the choice of what do you do in python and what do you do in Excel. As I’d started in Excel I didn’t want to waste time recreating stuff in python so all the calculations are in Excel. This is slow (but still fast enough for my use case). Depending on how advanced or complex your model becomes it may be better to move more of it to Excel. The trade off with this is now only you can use it or understand it.
Before I forget, there’s also VS Code. I use it at work as it’s free, I can install it without Admin rights and IT department haven’t questioned me on it (yet!), unlike PyCharm 🤔. I like to make use of the #%% cell divider in it. Partially as I’d been using this for a long time with Spyder (before VS Code existed) and also as it seems like a better way to work vs. notebooks. At least for me.
As always the documentation of the libraries is a great place to start - often the best place before you jump to tutorials.
The Randomness
Your uncertainity takes shape in many different ways. Sometimes is a continuous range, like our speed example before, or it’s discrete, like picking your starter Pokémon. In fact whatever the uncertainity is, numpy has a method to help you represent it. I actually think working out what your uncertainity looks like is the hardest part of all of it. Perhaps you could even have uncertainity on the uncertainity…Generally you want to ask an expert, maybe yourself, maybe someone else in your company, or whatever you can find online that seems reasonable. You can, of course, just try different ones in your model and see if it actually makes a difference to the decision you’re trying to make.
I ened up using choice and uniform distributions. Choice being my starter Pokémon, and uniform distribution being a range of numbers but they’re all equally likely to be picked.
My choice was actually choosing a range of numbers in Excel which would all change depending on what choice was picked.
The Code
So in all its glory:
import pandas as pd
import numpy as np
import seaborn as sns
import xlwings as xw
import matplotlib.pyplot as plt
sns.set_style(‘whitegrid’)
# Setup
excel = r"myexcel.xlsx"
wb = xw.Book(excel)
sheet = wb.sheets[‘Control Sheet’]
rng = np.random.default_rng()
iterations = 1000
POWER_LOWER = 100
POWER_UPPER = 120
CAPITAL_LOWER = 10000
CAPITAL_HIGHER = 30000
CO2_OPTIONS = [1, 2, 3]
npv = []
for i in range(iterations):
power_price = rng.uniform(low=POWER_LOWER, high=POWER_UPPER)
capital_cost = rng.uniform(low=CAPITAL_LOWER, high=CAPITAL_HIGHER)
co2_price = np.random.choice(CO2_OPTIONS)
sheet.<span class="hljs-built_in">range</span>(<span class="hljs-string">'B3'</span>).value = power_price / <span class="hljs-number">80</span>
sheet.<span class="hljs-built_in">range</span>(<span class="hljs-string">'B4'</span>).value = capital_cost
sheet.<span class="hljs-built_in">range</span>(<span class="hljs-string">'B9'</span>).value = co2_price
npv_new = sheet.<span class="hljs-built_in">range</span>(<span class="hljs-string">'B7'</span>).value

npv.append(npv_new)

results = pd.DataFrame(data={‘NPV10 £MM’: npv})
P90 = results.quantile(0.9)[0]
P50 = results.quantile(0.5)[0]
P10 = results.quantile(0.1)[0]
EV = results.mean()[0]
sns.displot(results, kind=“ecdf”)
print(f"EV: £{EV:.1f}MM, P10: £{P10:.1f}MM, P50: £{P50:.1f}MM, P90: £{P90:.1f}MM")
I made a few controls at the top so I could adjust the ranges of things. Fairly basic stuff otherwise, which I’m sure can be done better but was good enough for me. Being so simple makes it pretty easy to understand, even if you’ve never used these libraries before.
The whole thing is a loop that does the random sampling, insert those values into excel, excel then recalculates, then it takes the answer out and appends it to a list. Repeat that iterations times and there’s my data.
I create a pandas dataframe (probably lazy and it could be done in numpy but as I said, lazy.) from the list and then calculate some metrics from it. The P values are commonly used at work to express the range. Where P90 meaning 90% probability that the value is ≤ X. Or often viewed as most optimistic result, with P10 therefore being the most pessimistic result. Actually, I’ve seen companies define these in reverse so check before you confuse people.
Seaborn has a handy empirical cumulative distribution function (ecdf), that saves me thinking anything whatsoever (that’s the whole objective whilst at work right?). So I make one of those for the PowerPoint, and print out the final numbers in a nice line.
The other nice thing with VS Code is the data viewer. I can save the plot to a file and copy and paste the table of results straight from it without having to write it to a file first. Tiny things like that make life so much easier.
Conclusion
So pretty straight forward to make your deterministic Excel model into a fully probabilistic model capturing all the uncertainity and demonstrating all the potential outcomes that can happen. For free, in about 30 minutes of work.
I think probabilistic models should be used more often. Very rarely is it that everything is always known exactly and whilst your calculation isn’t wrong, it’s only one possible outcome. Better to give your decision maker (or yourself) a range of outcomes than just one. Tell them “they’re buying the curve”. Then hope the final result actually lands on the curve 😅
Drummer is awesome, so I made Awesome Drummer! Come contribute! 🥁
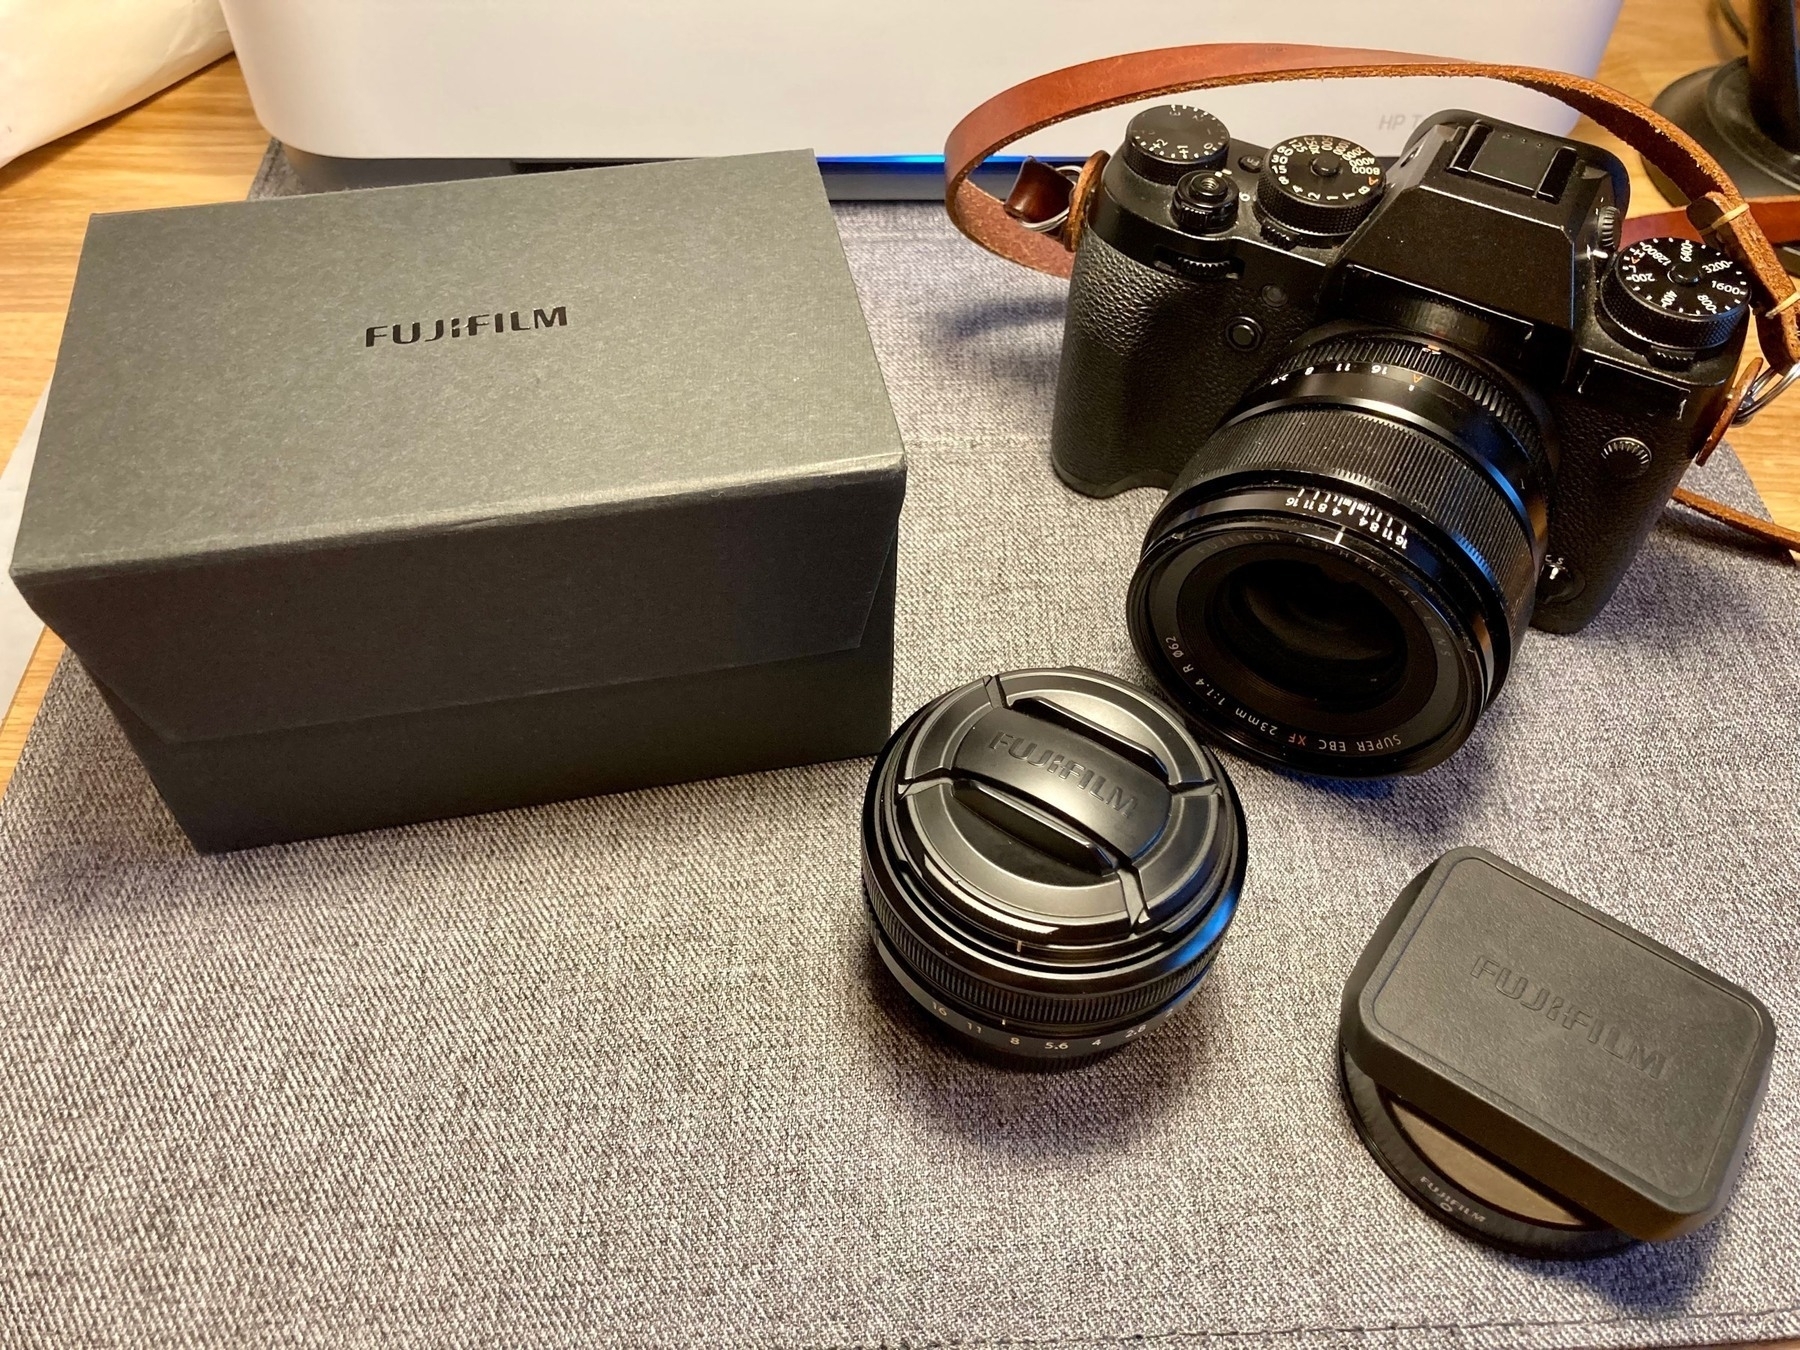
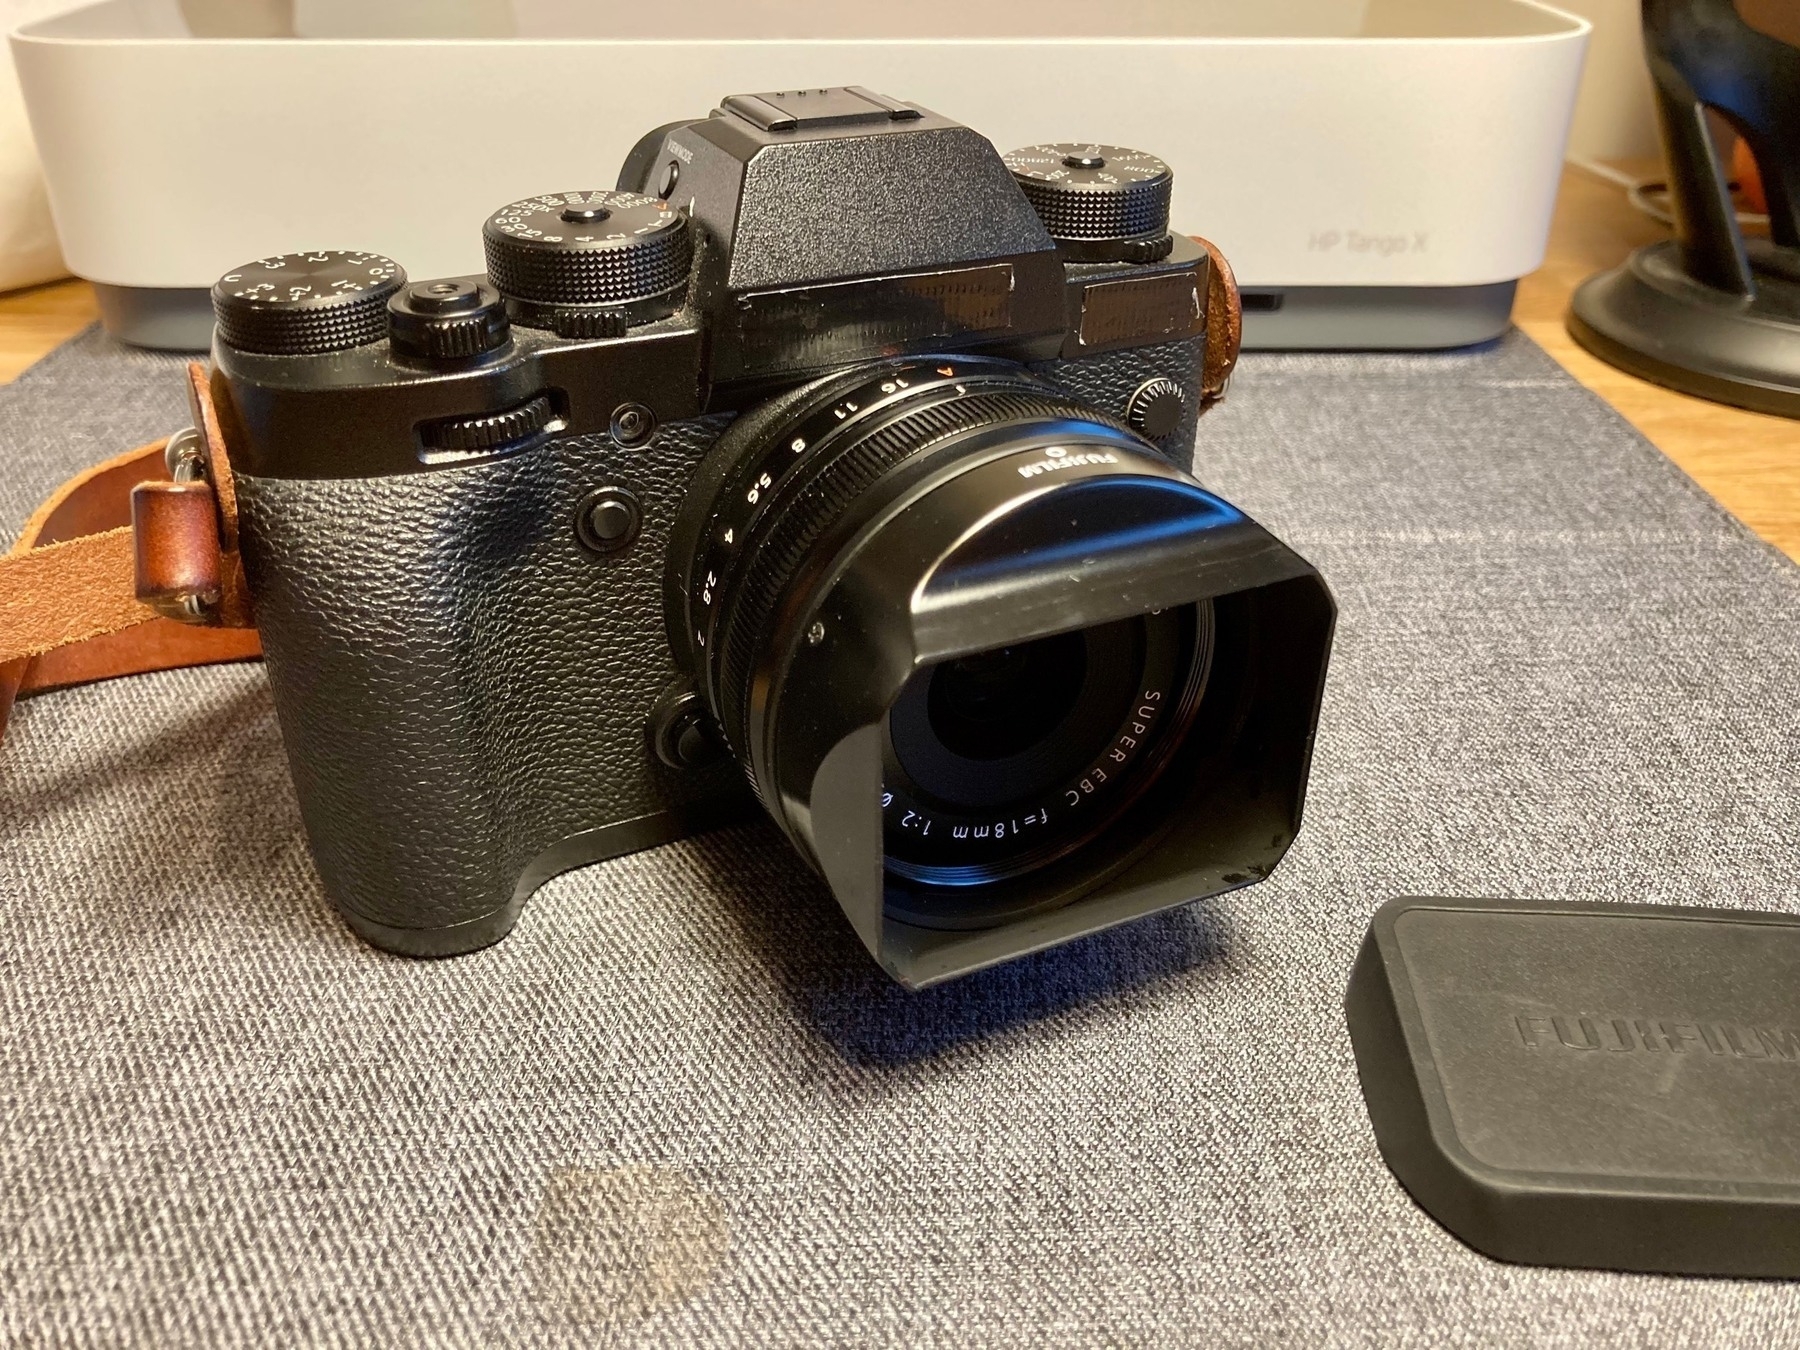
Fuji 18mm f/2 arrived. They old presentation boxes and metal hoods are lovely. It also focuses fast enough for my kids running around so, as usual, the internet exaggerates any issues.
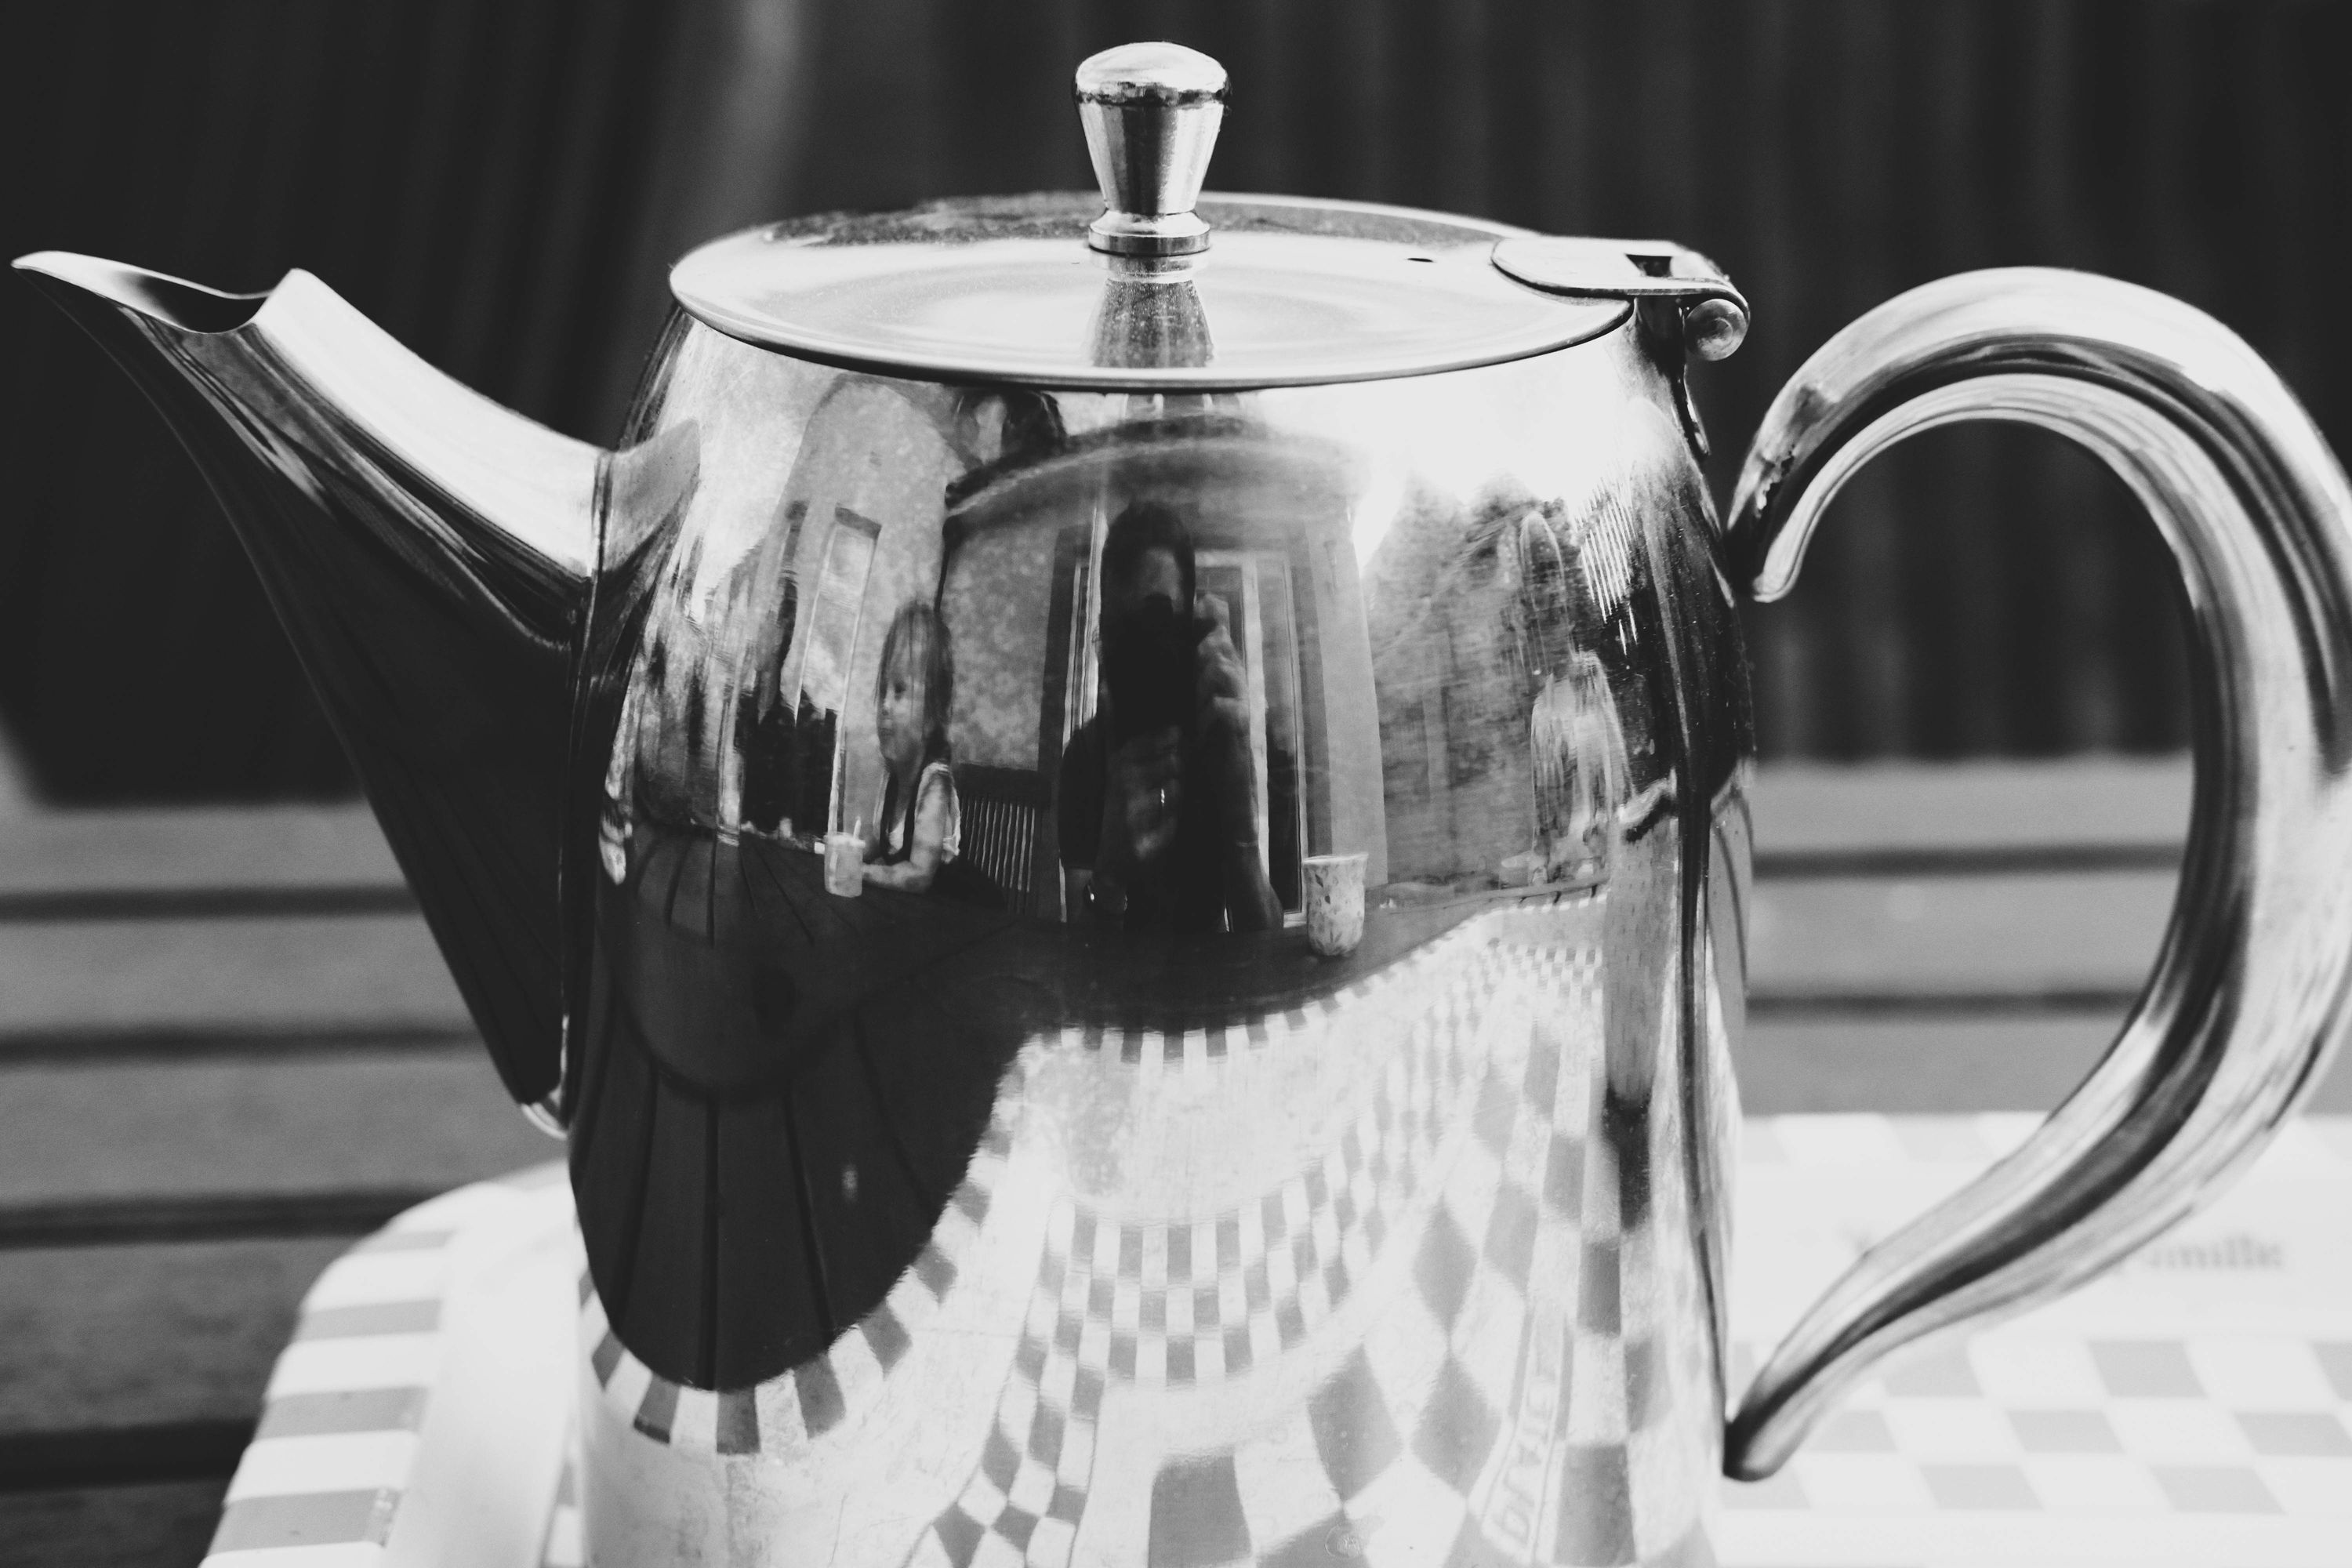
My favourite teapot
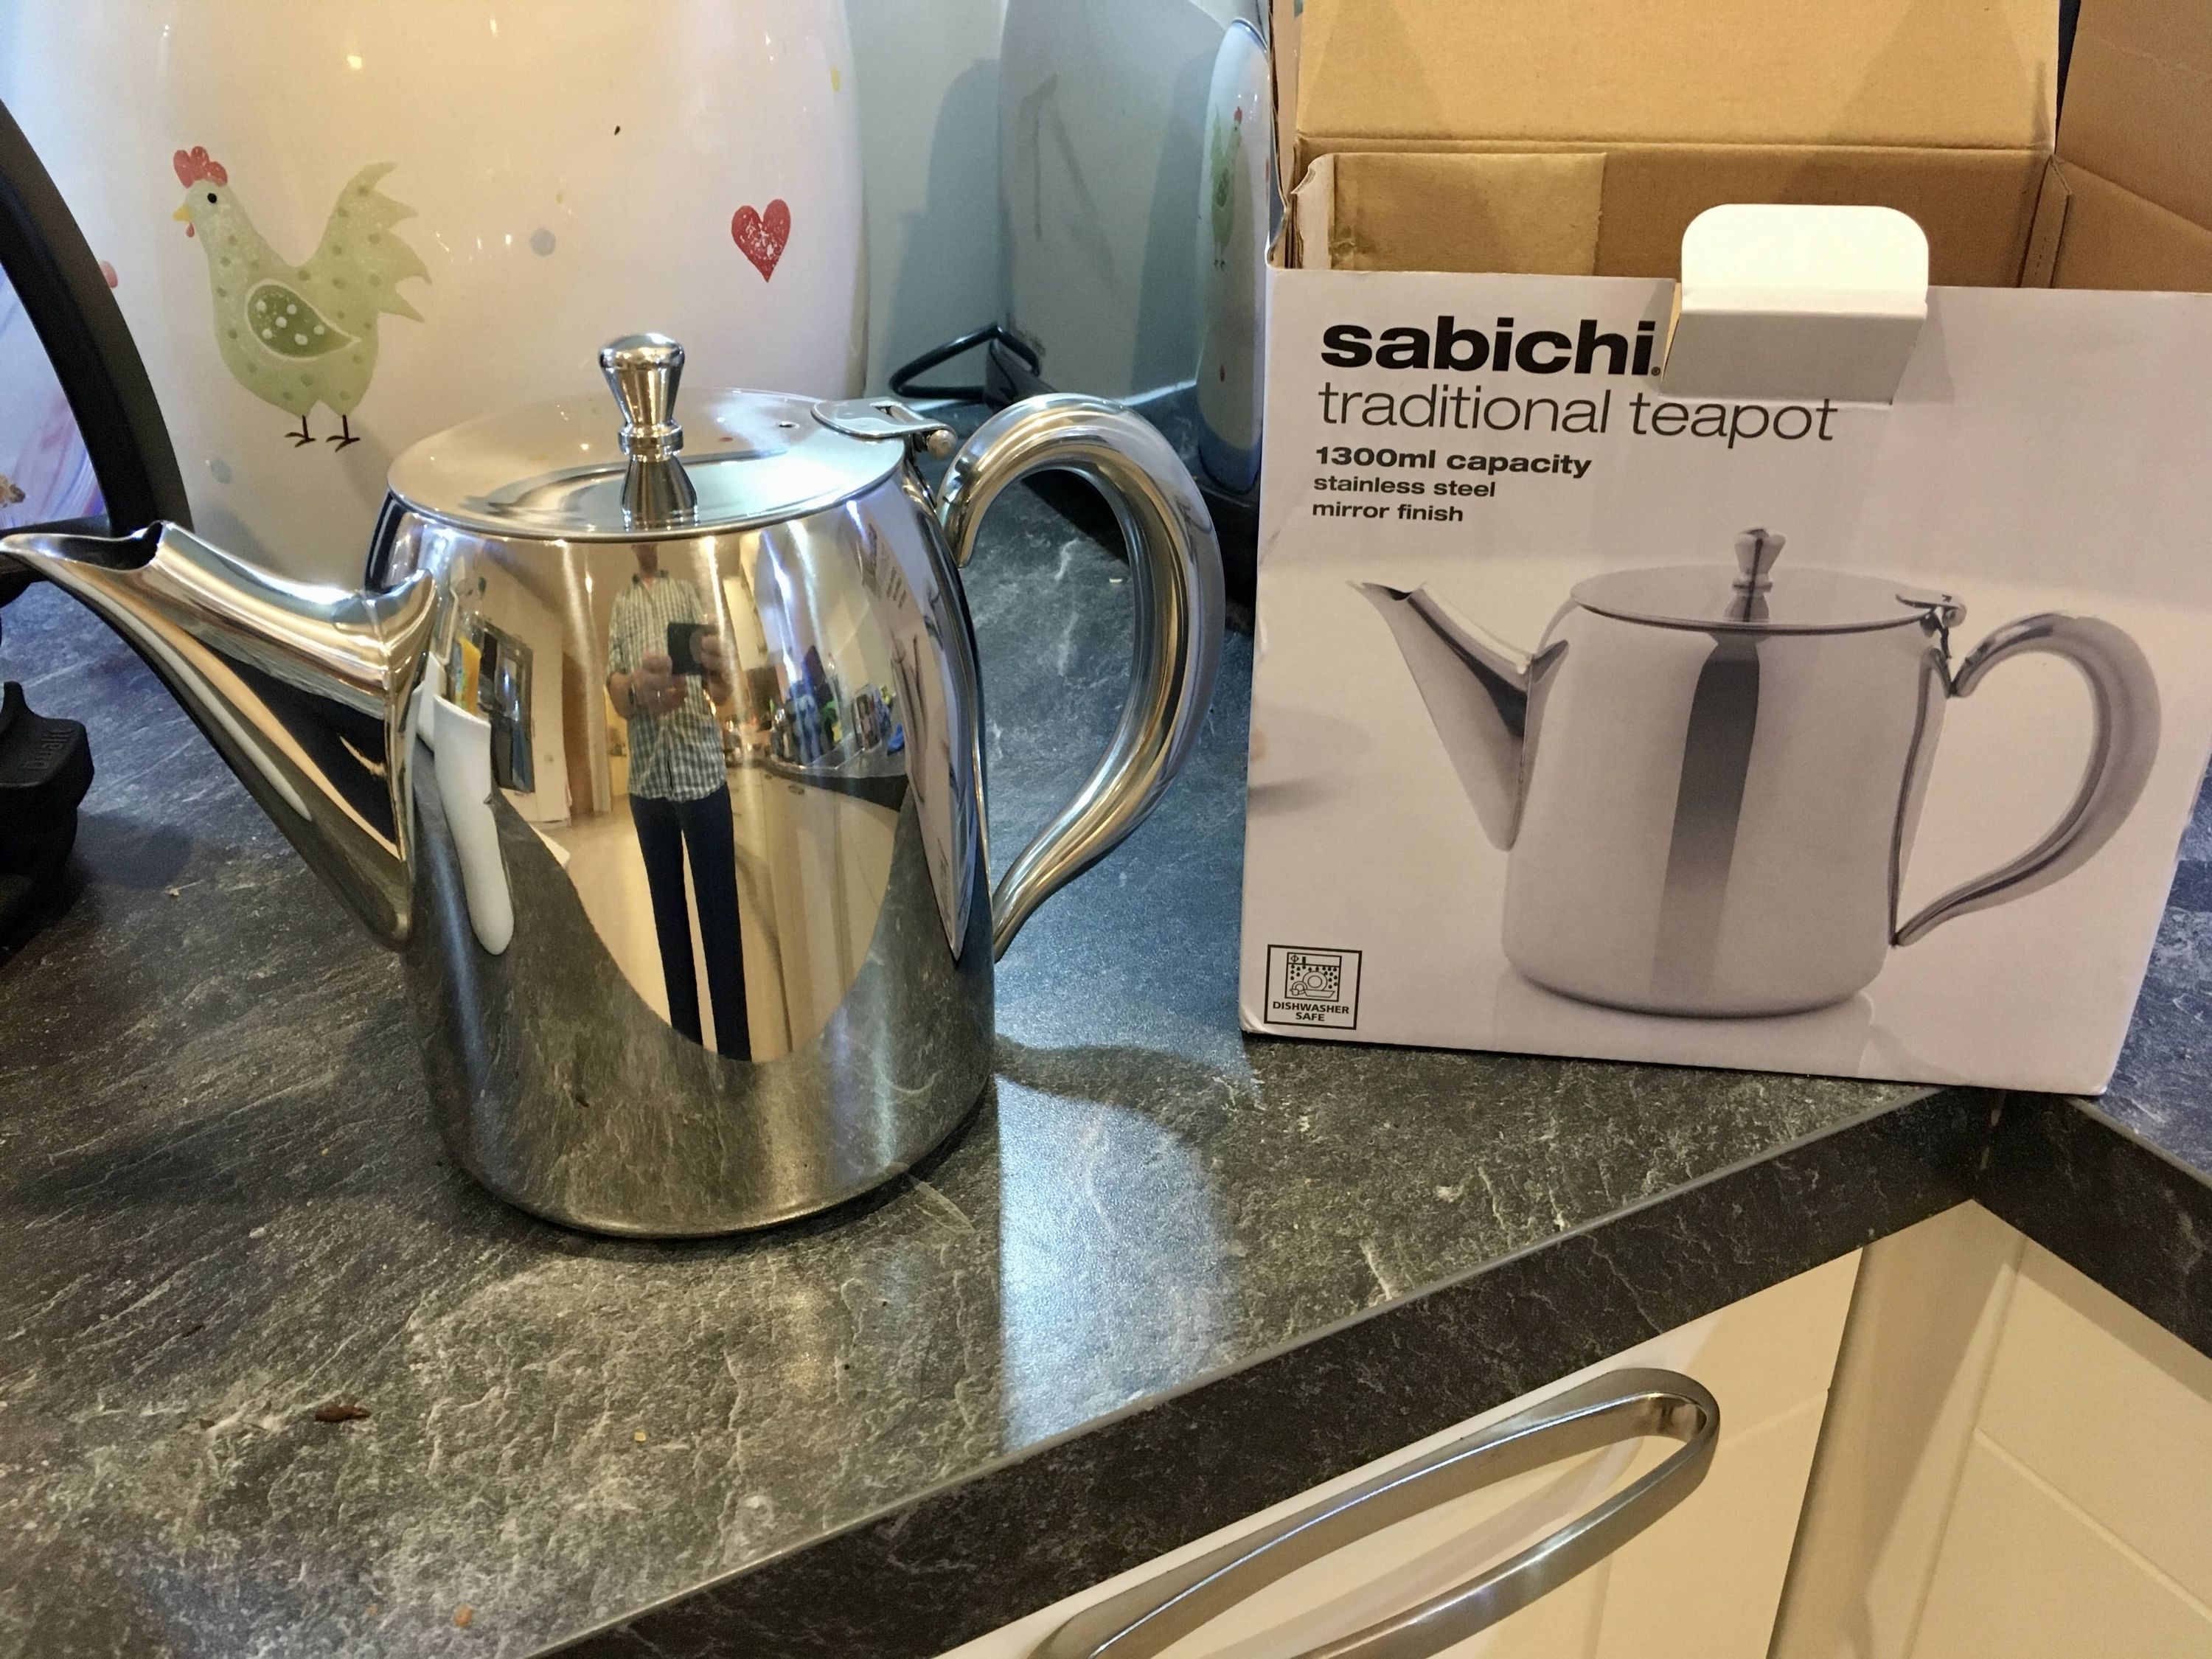 Sabinchi teapot and box
Like all favourites the real favourite always depends. It depends on the intent, at least for me. I suppose you could do a “of all time” or “best overall” style favourite. I think a common distinction is form over function. There are a lot of things that look great but are practically useless, even if - like a teapot - they should be used, they still may remain annoying.
So having said all that…I present the Sabichi classic stainless steel teapot.
It comes in a variety of sizes 720ml, 1300ml, and 1900ml, so big enough for even the largest tea drinking family. It’s also very reasonably priced at £16 for the medium sized one.
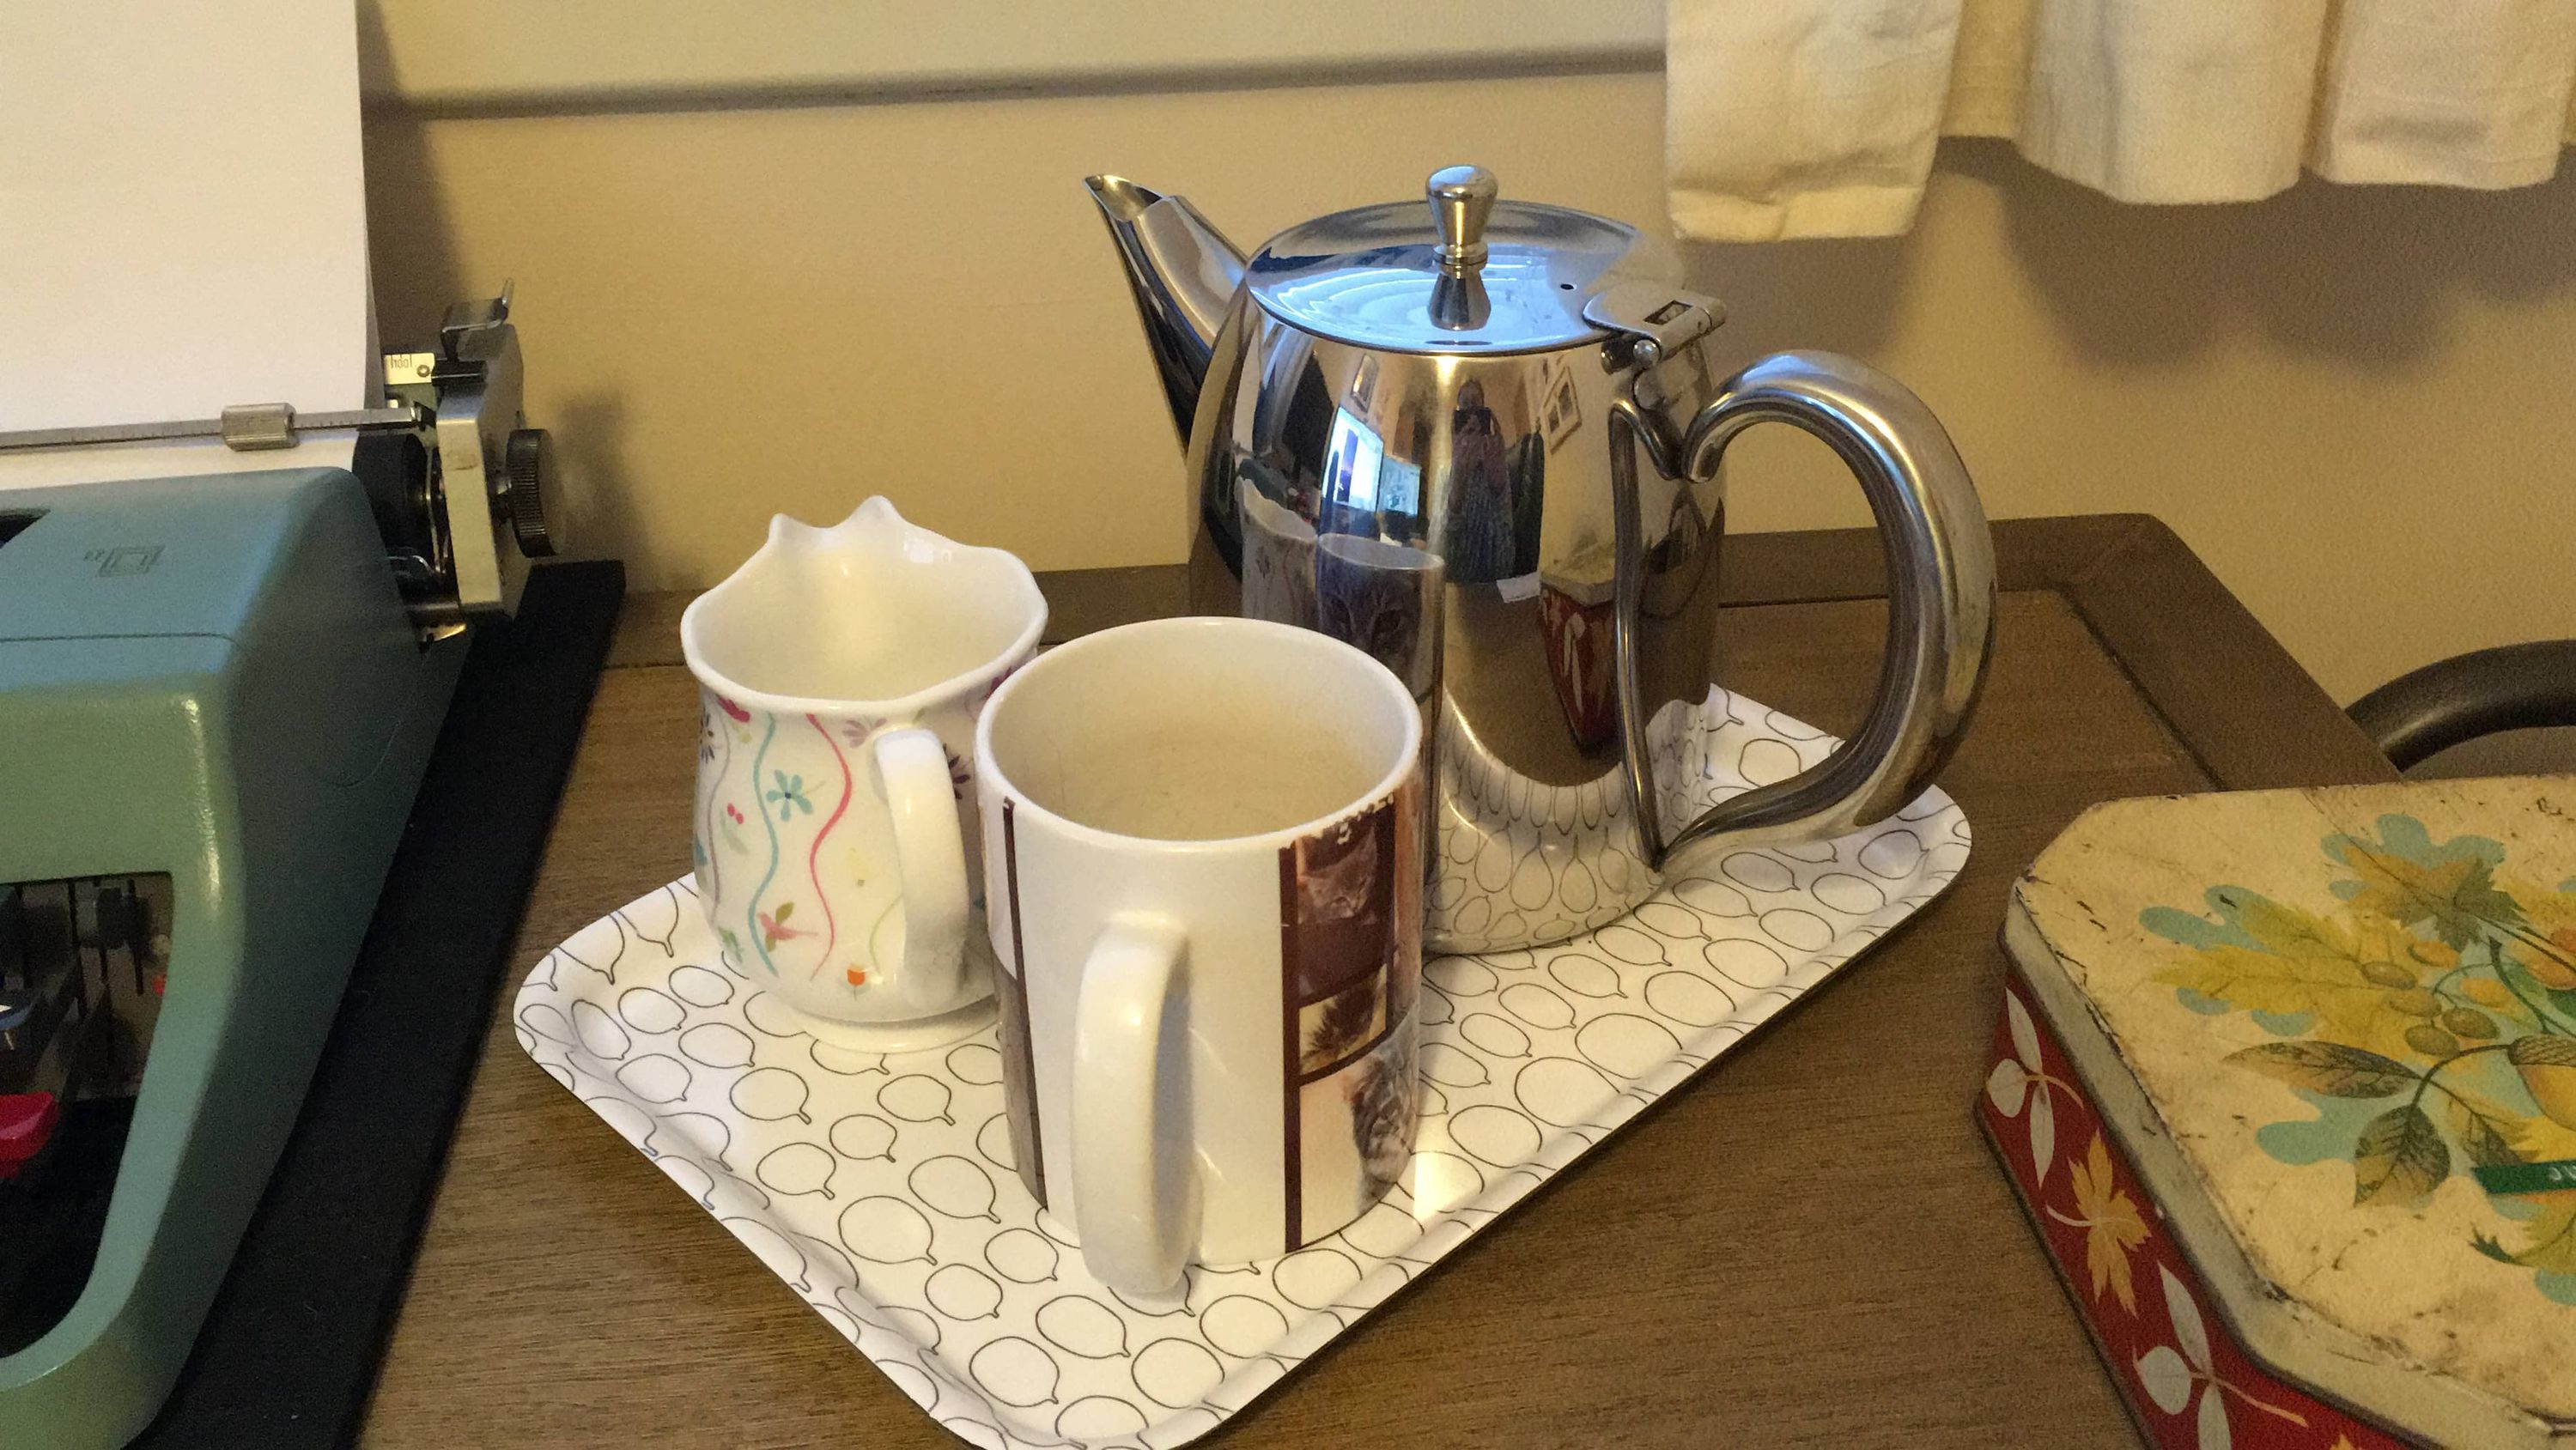
So why do I like it so much? It does the job very well: It has good capacity, it has a classic, timeless look and most importantly, it pours well. So many teapots have terrible spouts that drip or splash tea everywhere. I enjoy filling it up with 1.3 litres and then having several good sized mugs of tea. A teapot for one is fine but when visitors are around you don’t want to have to decide between a teabag per mug or tiny cups to use the tea pot.
 The joys of working at home
It has been perfect for working at home when the children are also home. I could make a good amount of tea and hide away in the office working, and not be worried about coming out and upsetting whatever is going on because I’m parched.
I just worry that I should maybe buy a spare in case this one breaks…
Hmm my tiddlywiki stopped adding the created field to new tiddlers…which then breaks everything 🤨
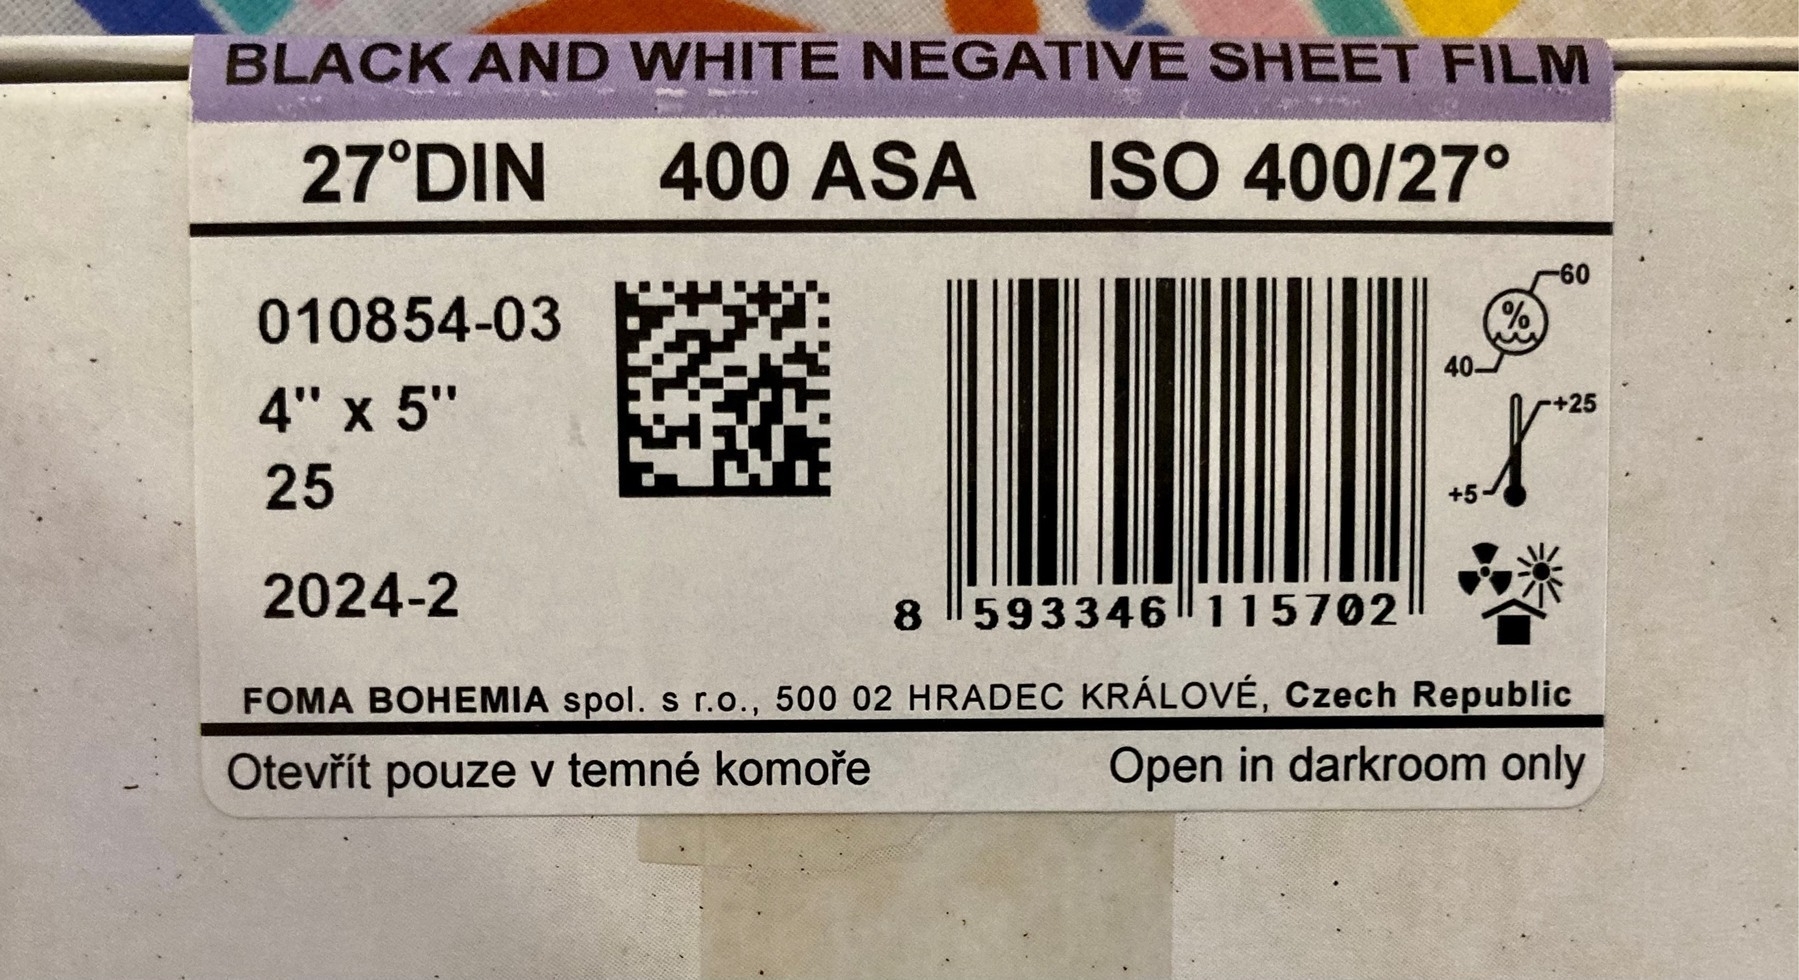
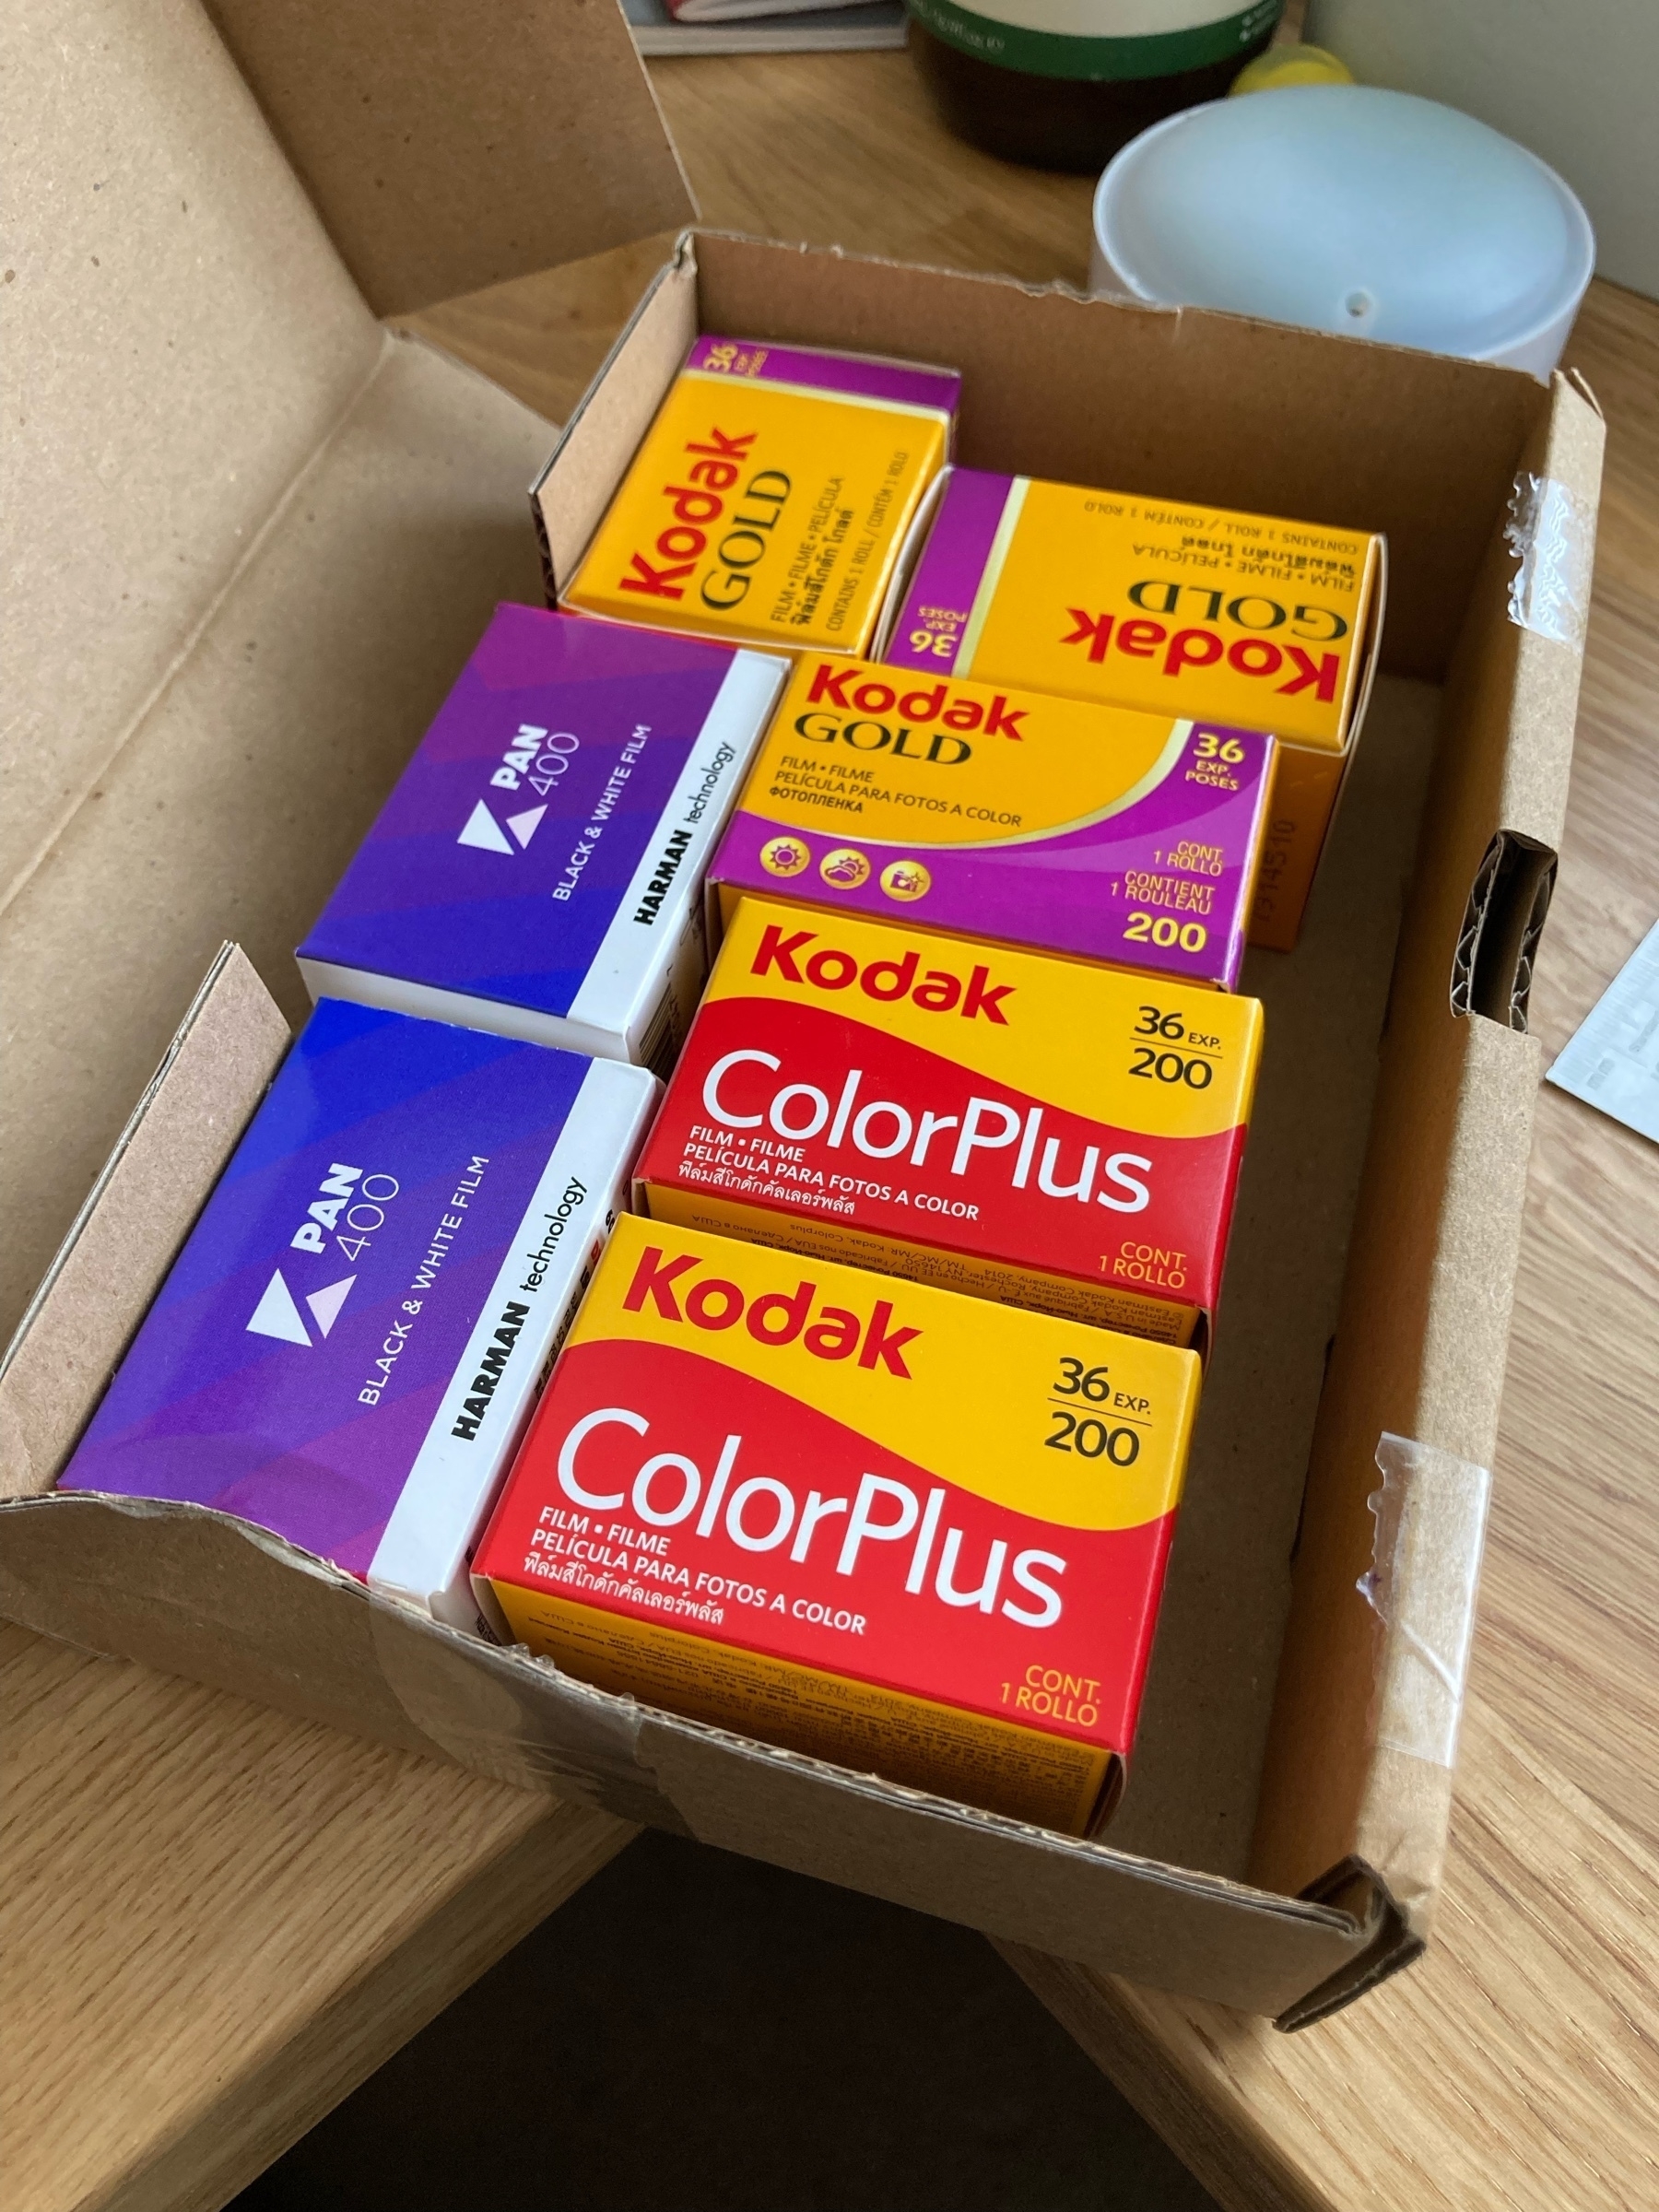
Cheap skate film day.
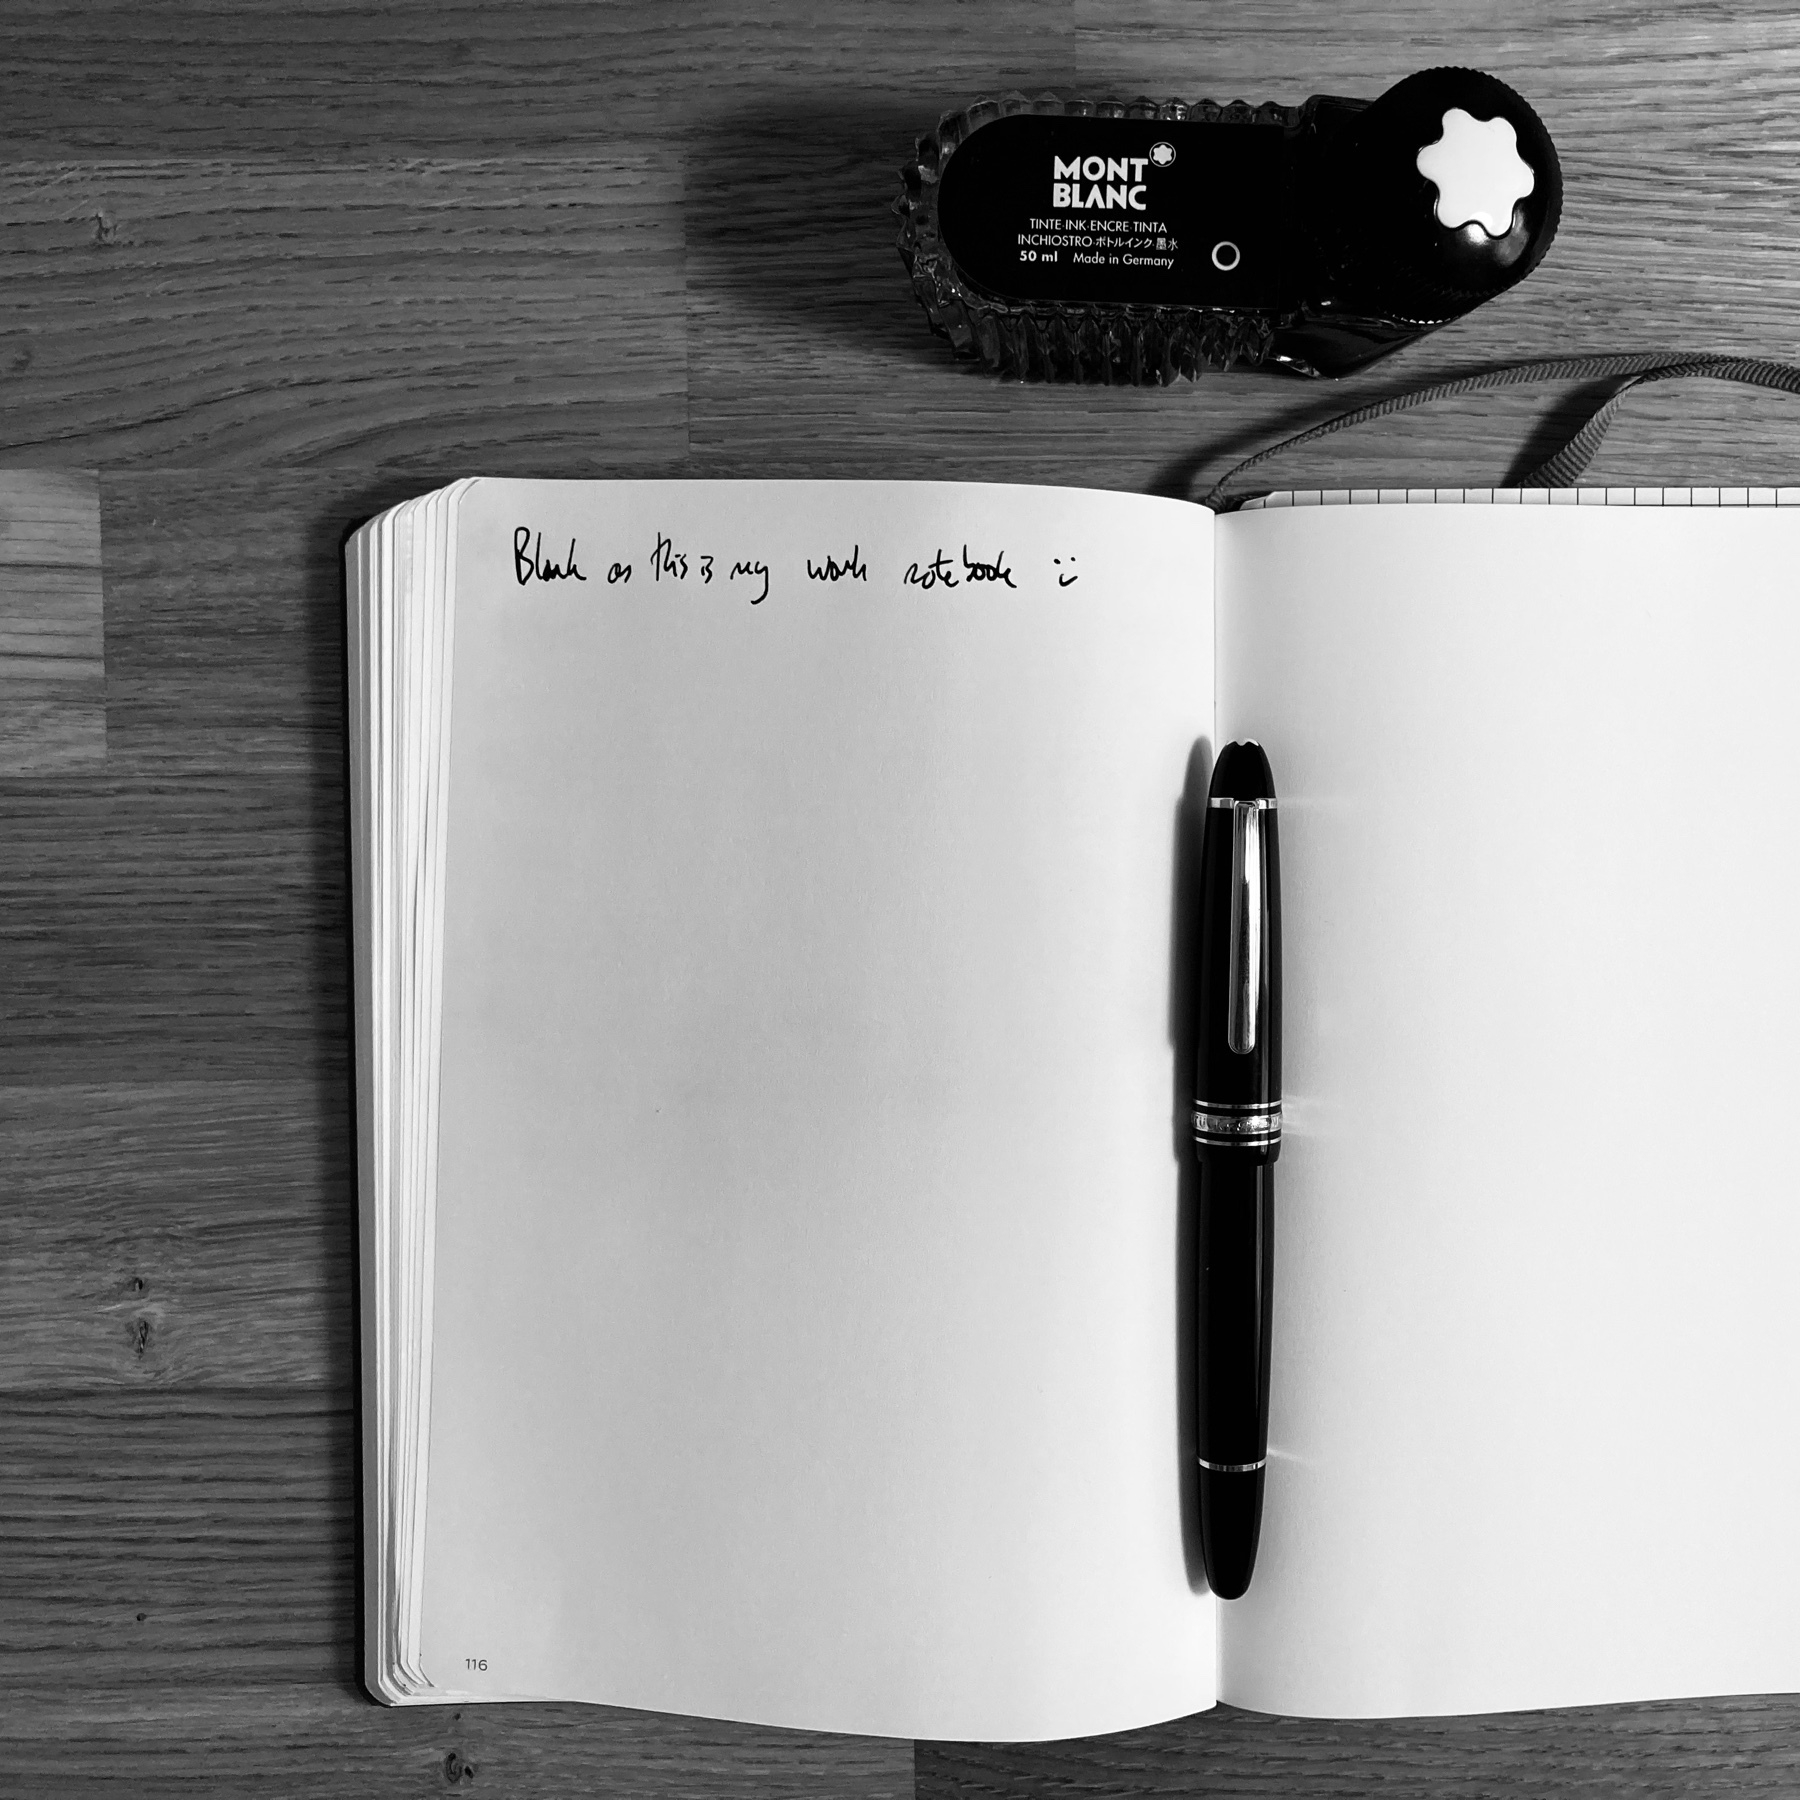
I haven’t used this pen in years. Maybe 10+. Always preferred the convenience of cartridges. Been using it everyday for work the past month and it’s lovely. 🖋

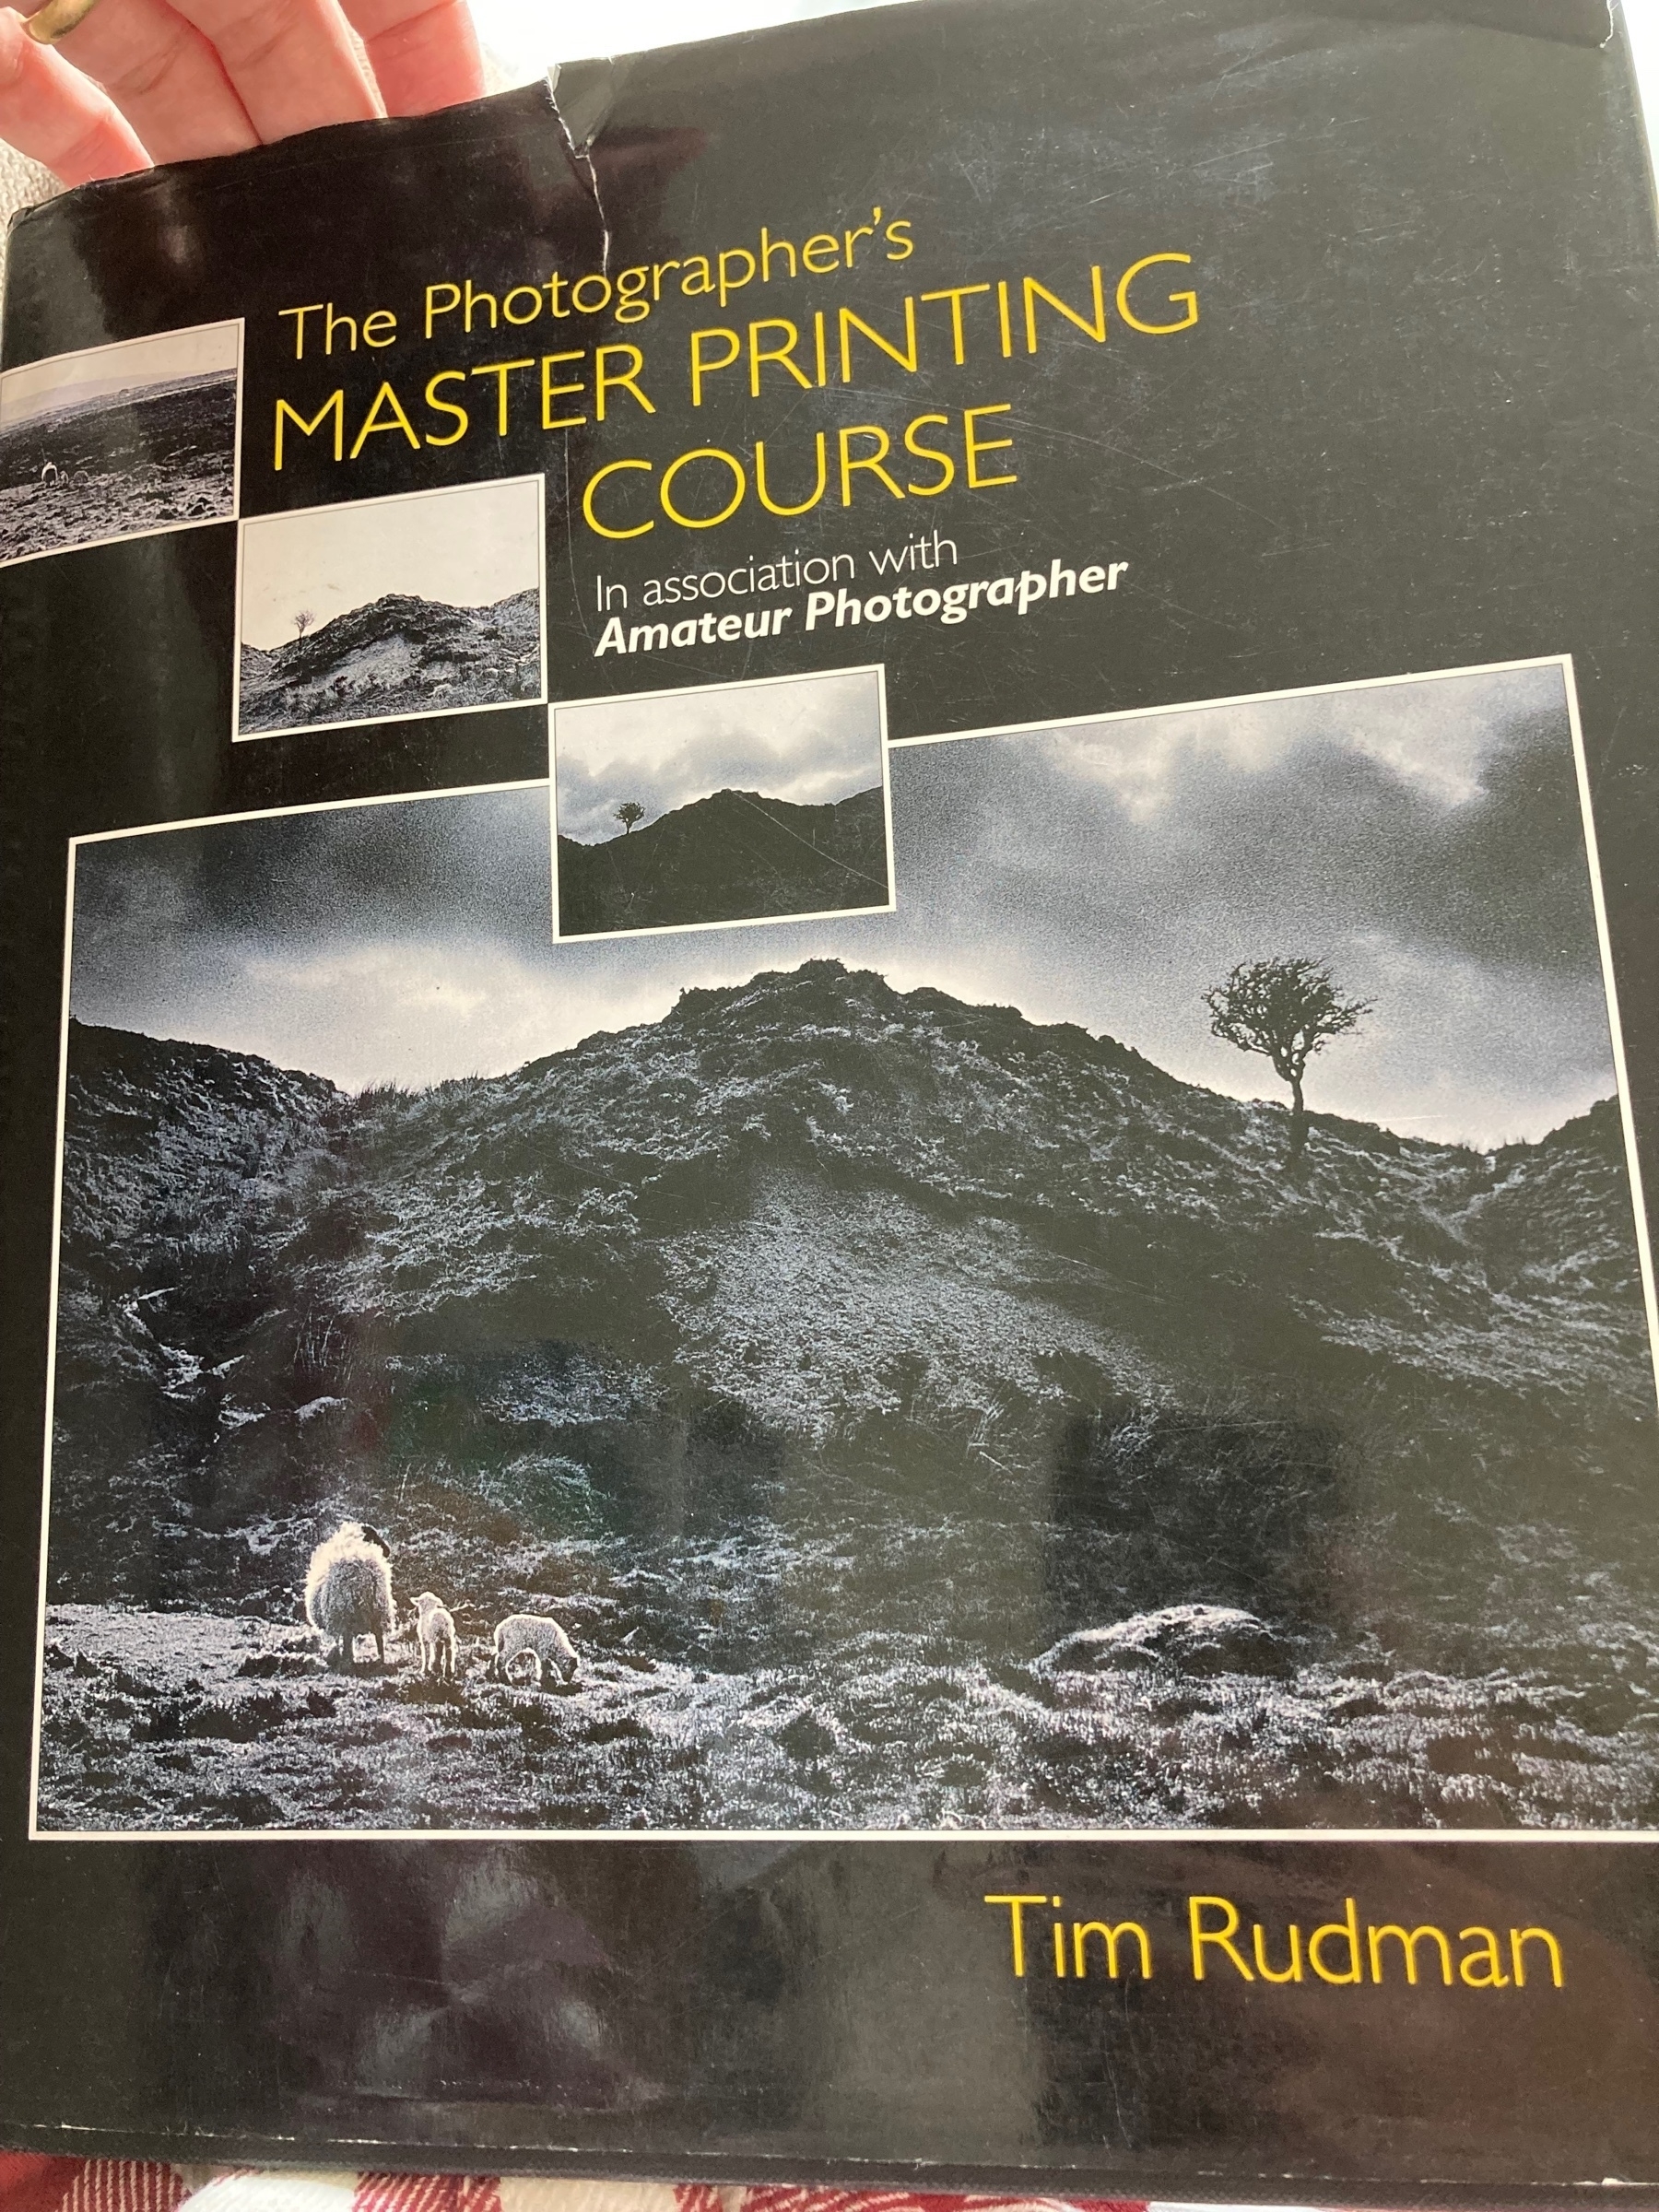
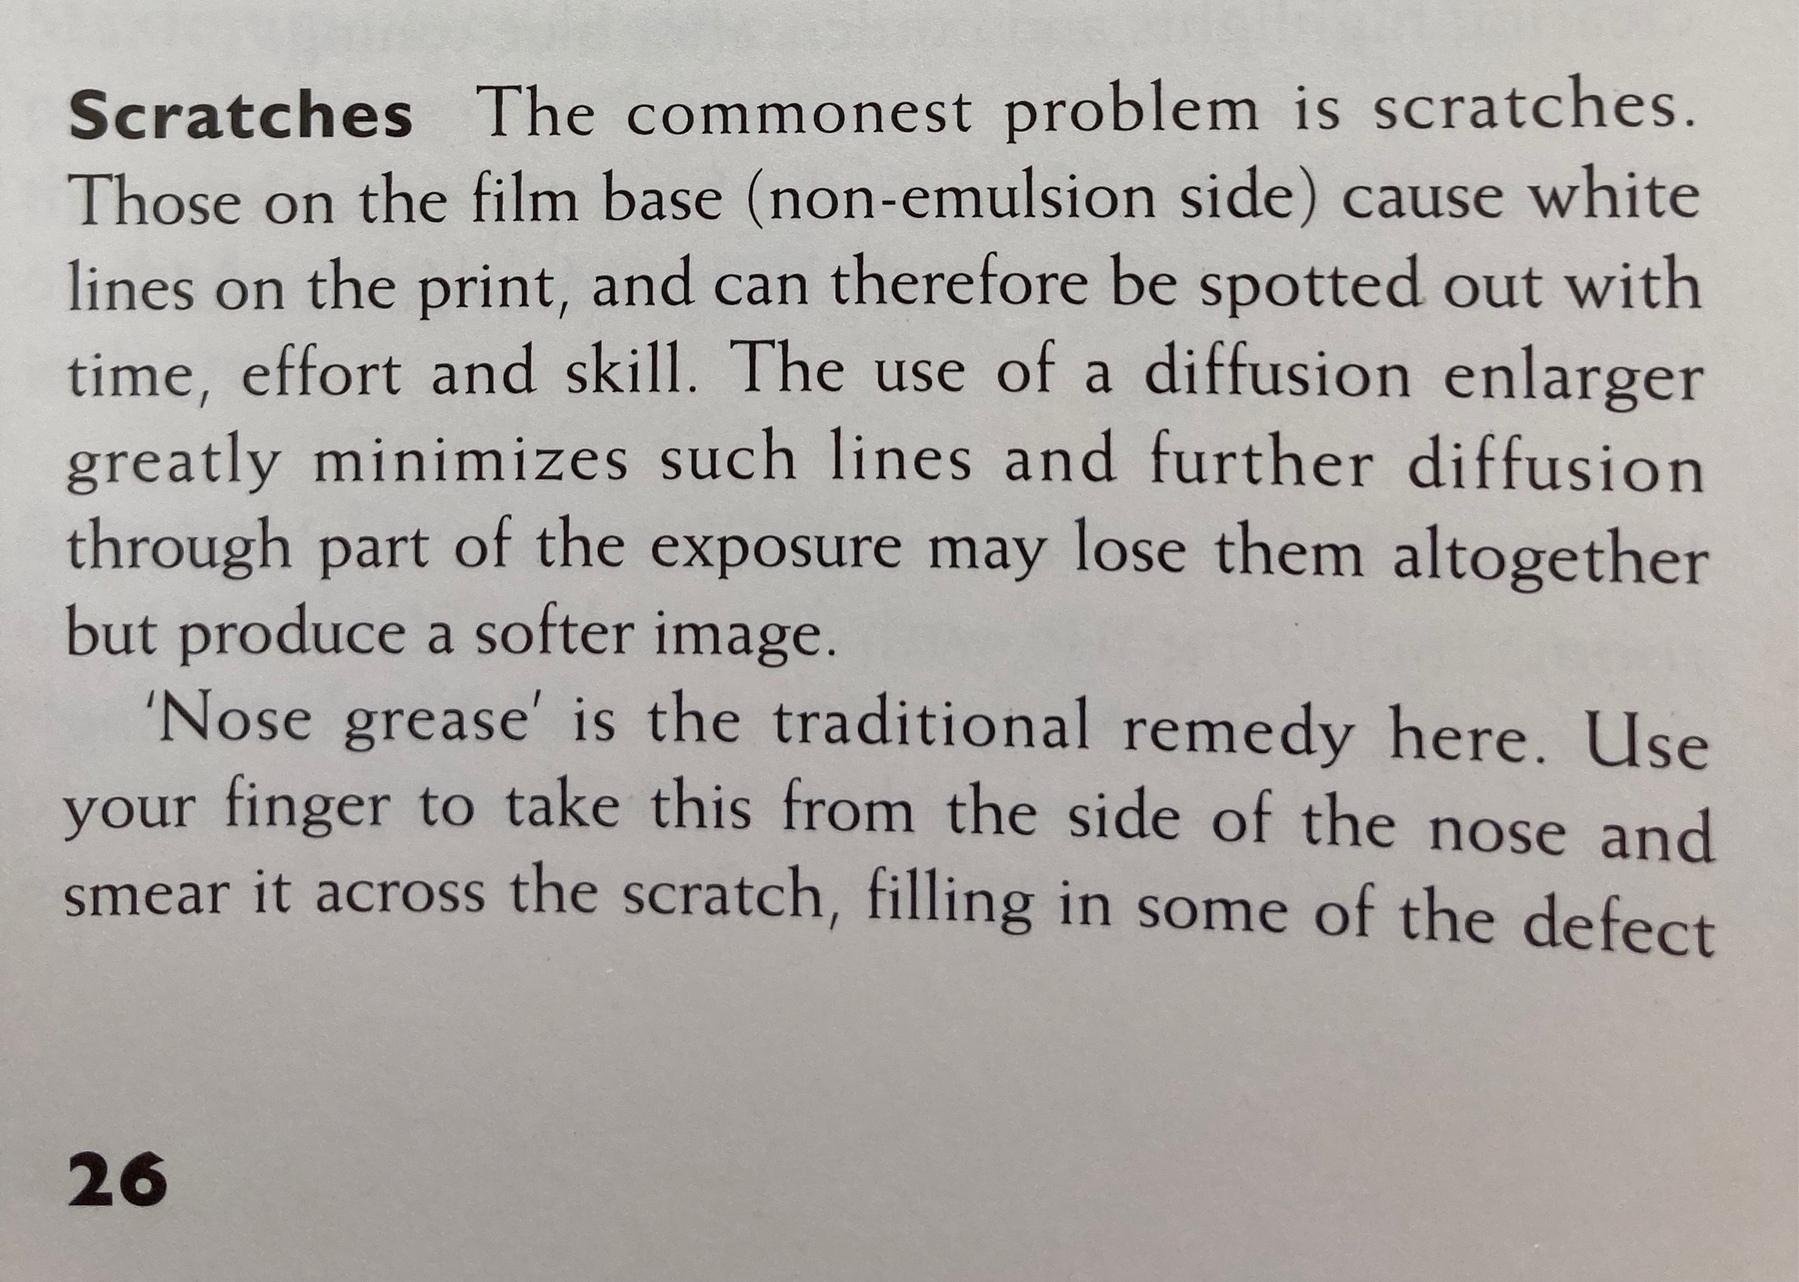
Reading through Tim Rushton’s printing book and came across an interesting technique for removing scratches on film! 📷
Lovely evening weather for writing a letter. 🖋