- Legend of Zelda (WiiU eShop)
- Legend of Zelda II: Adventure of Link Legend of Zelda (WiiU eShop)
- A Link to the Past Legend of Zelda (WiiU eShop)
- Ocarina of Time (64 version, not the 3DS update, WiiU eShop)
- Majora’s Mask (64 version, not 3DS update, on Wii eShop – requires you booting into Wii mode to buy and play)
- Wind Waker HD (disc or WiiU eShop)
- Minish Cap (WiiU eShop)
- Twilight Princess (Wii version, disc only)
- Skyward Sword (disc only)
- Breath of the Wild
- Legend of Zelda (eShop)
- Adventure of Link (eShop)
- Link’s Awakening DX (Gameboy Color version of the Gameboy title, eShop)
- Ocarina of Time 3D (eShop or game cart)
- Majora’s Mask 3D (eShop or game cart)
- Oracle of Ages (eShop)
- Oracle of Seasons (eShop)
- Four Swords (if you downloaded it during it’s limited availability; this was a small multiplayer game that was part of the GBA port of Link to the Past)
- Phantom Hourglass (DS, cart only)
- Spirit Tracks (DS, cart only)
- A Link Between Worlds (eShop or cart)
Generating lots of tiddlers
For my Meditations Tiddlywiki, I wanted to make each statement an individual tiddler. Whilst it doesn’t add a great deal to the site right now (beyond just viewing the minimum amount, the random tiddler button, and following the tiddlywiki mantra), I think it’ll be useful later on. Over time I’d like to add my own thoughts or interpretations to them, or maybe categorise favourite ones with new tags. Plus they might be useful for other people who can export tiddlers or download the file.
I had the site previously but it was one tiddler per book, and that didn’t make it very usable beyond just reading.
I find the easiest way to import lots of tiddlers is via a JSON file. Luckily I’d found a JSON file of Meditations some time ago. It’s easy to find the text but that’s not always as easily parsed as as structured document. The JSON was just book and then each line. I still needed to get the title, tags, and fields sorted out before I could import into a blank Tiddlywiki.
The general structure of JSON to be imported looks like this:
[
    {
        "created": "20211215114254021",
        "text": "More content",
        "tags": "Home [[Book 1]]",
        "title": "2nd tiddler",
        "modified": "20211215114322673",
        "book": "3",
        "section": "12"
    },
    {
        "created": "20211215112427768",
        "text": "Content",
        "tags": "Home",
        "title": "Meditations",
        "modified": "20211215112535190",
        "section": "1",
        "book": "2"
    }
]
The section and book are fields I added and the rest should be obvious. Tags with spaces need to be in [[ ]]. So all I’d need to do is iterate over the JSON file and create new entries that matched this structure.
The first issue I came across was knowing how many sections per book there are. I made a new list of the number of sections and stored that in the meditations.json file. Whilst not necessary (as I could’ve used the code to generate this later on), I thought it might be helpful and more efficient to compute it once and store the results. data is the json file as you’ll see shortly.
sectionCount = [len(data["meditations"][f"{x}"]) for x in range(1,13)]
So now that I have everything it was just a case of building the list in the format I wanted and writing it to a file. Here’s the code:
import json

with open("meditations.json", "r") as read_file:
    data = json.load(read_file)

book_names = [
    "Book I",
    "Book II",
    "Book III",
    "Book IV",
    "Book V",
    "Book VI",
    "Book VII",
    "Book VIII",
    "Book IX",
    "Book X",
    "Book XI",
    "Book XII",
    ]

result = []

for book in range(12):
    for section in range(data["sectionCount"][book]):
        book_name = book_names[book]
        title = f"{book_name} - Section {section + 1}"
        tags = f"[[{book_name}]]"
        quote = data['meditations'][f"{book + 1}"][section]

        # Create each tiddler
        entry = dict()
        entry["created"] = "-01800000000000000"  # that's 180BC
        entry["text"] = quote
        entry["tags"] = tags
        entry["title"] = title
        entry["section"] = f"{section + 1}"
        entry["book"] = f"{book + 1}"

        result.append(entry)

# Write to json file
with open("tw_data.json", "w") as write_file:
    json.dump(result, write_file)
I started going down the route of converting the book number to roman numerals but given the one off nature of this I just made a list of the names I wanted for the books. 😅
I then just imported into a blank Tiddlywiki, made a few other pages and a table of contents macro tiddler and it’s good to go!
What could go wrong.
Monte Carlo Simulation in Excel with Python
There are quite a few blogs that show you how to do Monte Carlo simulations using python. A very accessible one is from Practical Business Python. Always a great site for python in the workplace for non-devs. However, I couldn’t find one that did just what I wanted, namely, take a model I’d already built in Excel and then apply some randomness and plot the S-curve (cumulative distribution function).
Maybe if I’d searched more I’d find one but instead I just got on with it. I also used to have some software at work that did this for me, it was an add-on to Excel but work stopped paying for it and I found it hard to justify it (it’s an Oracle product so no doubt pricey). Plus I always love an excuse to try and learn a bit more python.
Background
If you don’t know, Monte Carlo simulation is a way to capture uncertainity. If a friend is driving to your house, 50 miles away, and they travel at 50 mph it’ll take then one hour right? Well, not always. Maybe they are keen on the gas and drive faster, or maybe there’s an accident and they get stuck. You just never know. So you could use monte carlo to say that their average journey speed could be from 40-60 mph, then you randomly sample many many times from that range and work out the time it takes. Do it 10,000 times and you then have 10,000 results that you can draw estimates from, e.g. the average time. You can also plot the results and show the whole range.
Tools
The main python tools to get this working is numpy for the random sampling and xlwings for interacting with Excel. Like all python libraries, these tools do way more than just what I need. I also used pandas, seaborn and matplotlib. Probably unnecessary but they’re quick to work with as I already know the gist of them.
Then of course there’s Excel, which needs no introduction. I’d already built my deterministic model in Excel, where all my inputs were in one table that could be changed and then the outputs were in another to be read.
There’s always going to be the choice of what do you do in python and what do you do in Excel. As I’d started in Excel I didn’t want to waste time recreating stuff in python so all the calculations are in Excel. This is slow (but still fast enough for my use case). Depending on how advanced or complex your model becomes it may be better to move more of it to Excel. The trade off with this is now only you can use it or understand it.
Before I forget, there’s also VS Code. I use it at work as it’s free, I can install it without Admin rights and IT department haven’t questioned me on it (yet!), unlike PyCharm 🤔. I like to make use of the #%% cell divider in it. Partially as I’d been using this for a long time with Spyder (before VS Code existed) and also as it seems like a better way to work vs. notebooks. At least for me.
As always the documentation of the libraries is a great place to start - often the best place before you jump to tutorials.
The Randomness
Your uncertainity takes shape in many different ways. Sometimes is a continuous range, like our speed example before, or it’s discrete, like picking your starter Pokémon. In fact whatever the uncertainity is, numpy has a method to help you represent it. I actually think working out what your uncertainity looks like is the hardest part of all of it. Perhaps you could even have uncertainity on the uncertainity…Generally you want to ask an expert, maybe yourself, maybe someone else in your company, or whatever you can find online that seems reasonable. You can, of course, just try different ones in your model and see if it actually makes a difference to the decision you’re trying to make.
I ened up using choice and uniform distributions. Choice being my starter Pokémon, and uniform distribution being a range of numbers but they’re all equally likely to be picked.
My choice was actually choosing a range of numbers in Excel which would all change depending on what choice was picked.
The Code
So in all its glory:
import pandas as pd
import numpy as np
import seaborn as sns
import xlwings as xw
import matplotlib.pyplot as plt
sns.set_style(‘whitegrid’)
# Setup
excel = r"myexcel.xlsx"
wb = xw.Book(excel)
sheet = wb.sheets[‘Control Sheet’]
rng = np.random.default_rng()
iterations = 1000
POWER_LOWER = 100
POWER_UPPER = 120
CAPITAL_LOWER = 10000
CAPITAL_HIGHER = 30000
CO2_OPTIONS = [1, 2, 3]
npv = []
for i in range(iterations):
power_price = rng.uniform(low=POWER_LOWER, high=POWER_UPPER)
capital_cost = rng.uniform(low=CAPITAL_LOWER, high=CAPITAL_HIGHER)
co2_price = np.random.choice(CO2_OPTIONS)
sheet.<span class="hljs-built_in">range</span>(<span class="hljs-string">'B3'</span>).value = power_price / <span class="hljs-number">80</span>
sheet.<span class="hljs-built_in">range</span>(<span class="hljs-string">'B4'</span>).value = capital_cost
sheet.<span class="hljs-built_in">range</span>(<span class="hljs-string">'B9'</span>).value = co2_price
npv_new = sheet.<span class="hljs-built_in">range</span>(<span class="hljs-string">'B7'</span>).value

npv.append(npv_new)

results = pd.DataFrame(data={‘NPV10 £MM’: npv})
P90 = results.quantile(0.9)[0]
P50 = results.quantile(0.5)[0]
P10 = results.quantile(0.1)[0]
EV = results.mean()[0]
sns.displot(results, kind=“ecdf”)
print(f"EV: £{EV:.1f}MM, P10: £{P10:.1f}MM, P50: £{P50:.1f}MM, P90: £{P90:.1f}MM")
I made a few controls at the top so I could adjust the ranges of things. Fairly basic stuff otherwise, which I’m sure can be done better but was good enough for me. Being so simple makes it pretty easy to understand, even if you’ve never used these libraries before.
The whole thing is a loop that does the random sampling, insert those values into excel, excel then recalculates, then it takes the answer out and appends it to a list. Repeat that iterations times and there’s my data.
I create a pandas dataframe (probably lazy and it could be done in numpy but as I said, lazy.) from the list and then calculate some metrics from it. The P values are commonly used at work to express the range. Where P90 meaning 90% probability that the value is ≤ X. Or often viewed as most optimistic result, with P10 therefore being the most pessimistic result. Actually, I’ve seen companies define these in reverse so check before you confuse people.
Seaborn has a handy empirical cumulative distribution function (ecdf), that saves me thinking anything whatsoever (that’s the whole objective whilst at work right?). So I make one of those for the PowerPoint, and print out the final numbers in a nice line.
The other nice thing with VS Code is the data viewer. I can save the plot to a file and copy and paste the table of results straight from it without having to write it to a file first. Tiny things like that make life so much easier.
Conclusion
So pretty straight forward to make your deterministic Excel model into a fully probabilistic model capturing all the uncertainity and demonstrating all the potential outcomes that can happen. For free, in about 30 minutes of work.
I think probabilistic models should be used more often. Very rarely is it that everything is always known exactly and whilst your calculation isn’t wrong, it’s only one possible outcome. Better to give your decision maker (or yourself) a range of outcomes than just one. Tell them “they’re buying the curve”. Then hope the final result actually lands on the curve 😅
Drummer is awesome, so I made Awesome Drummer! Come contribute! 🥁
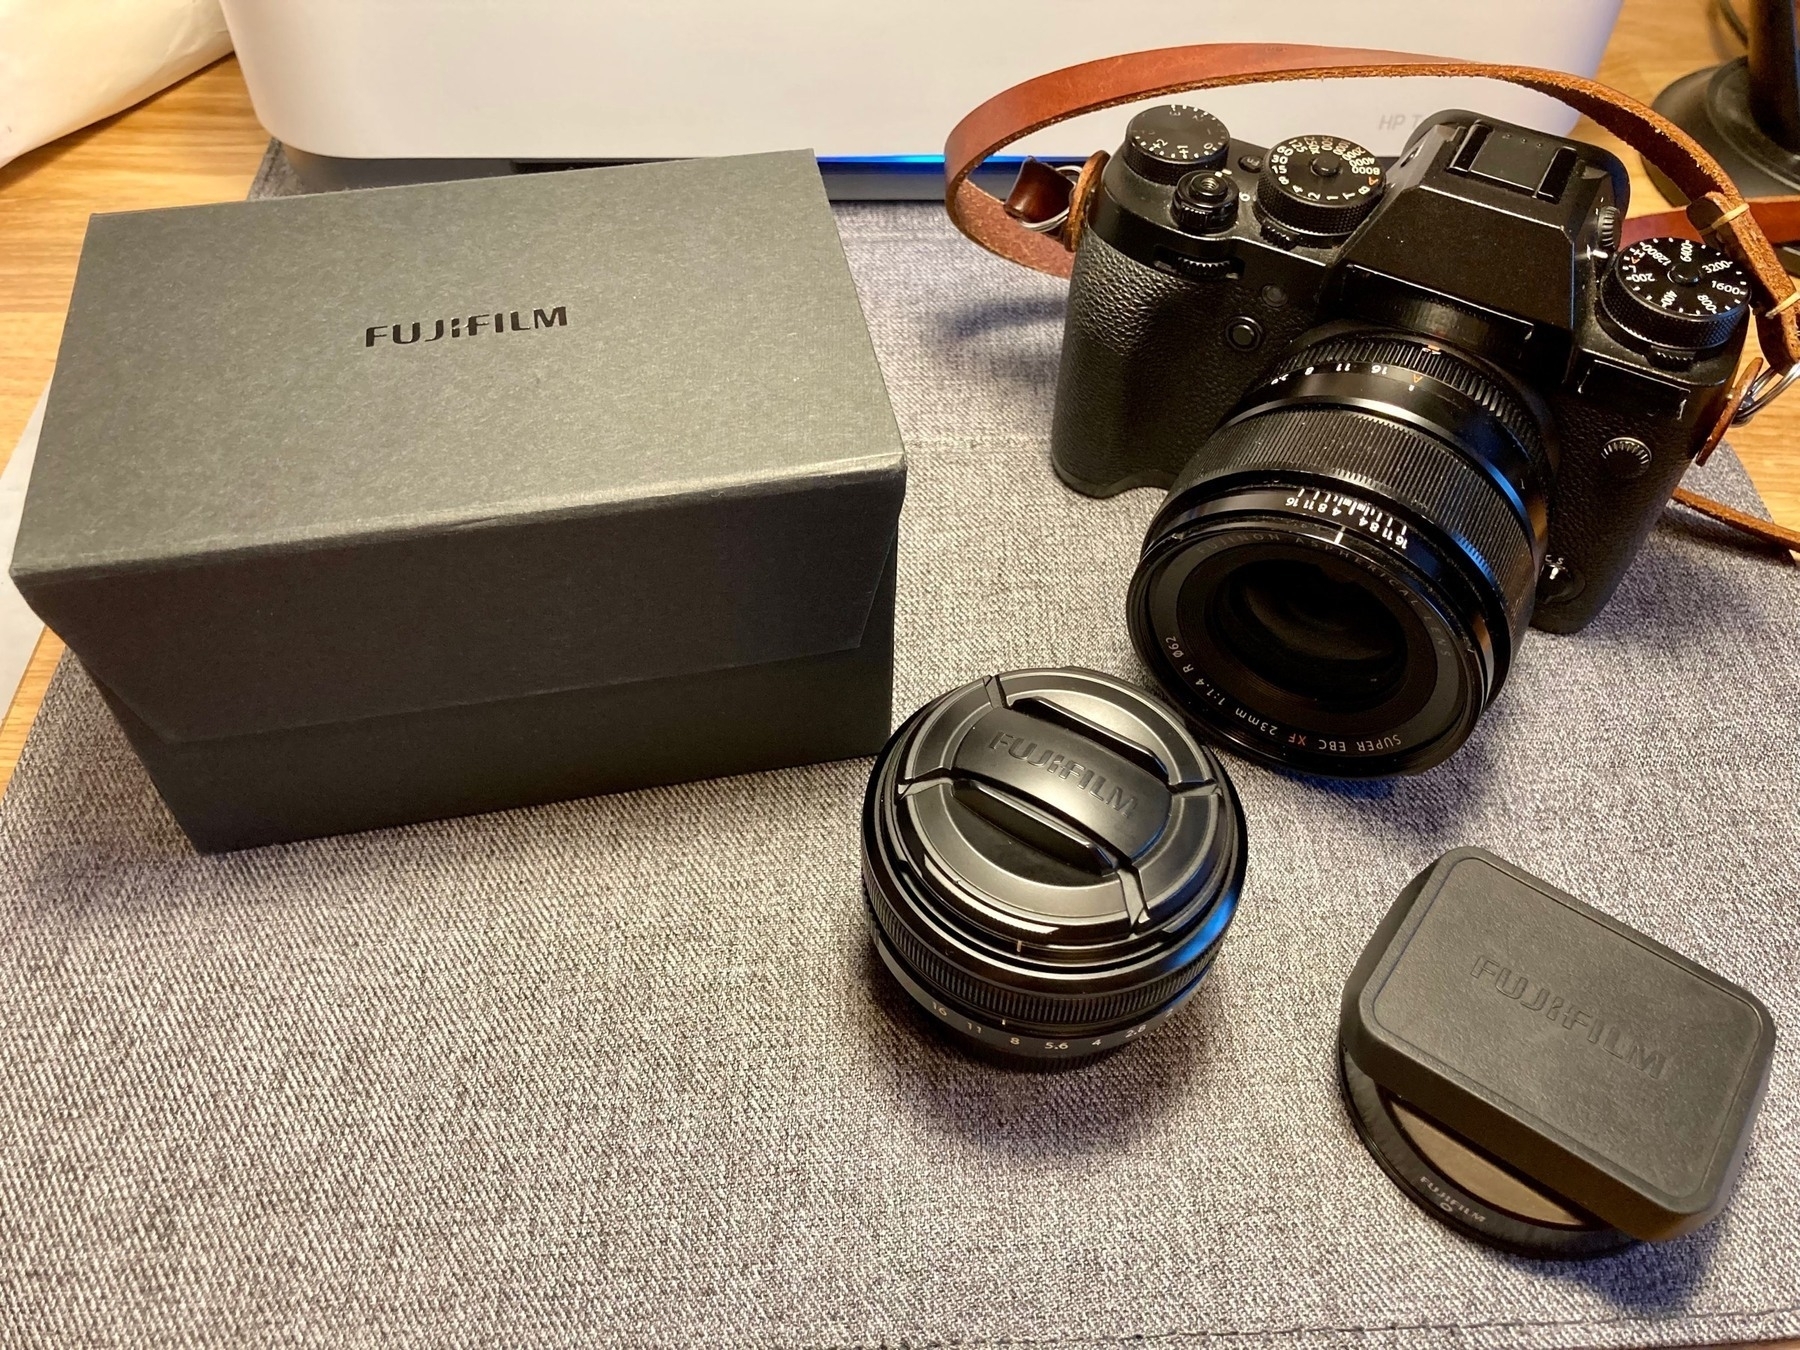
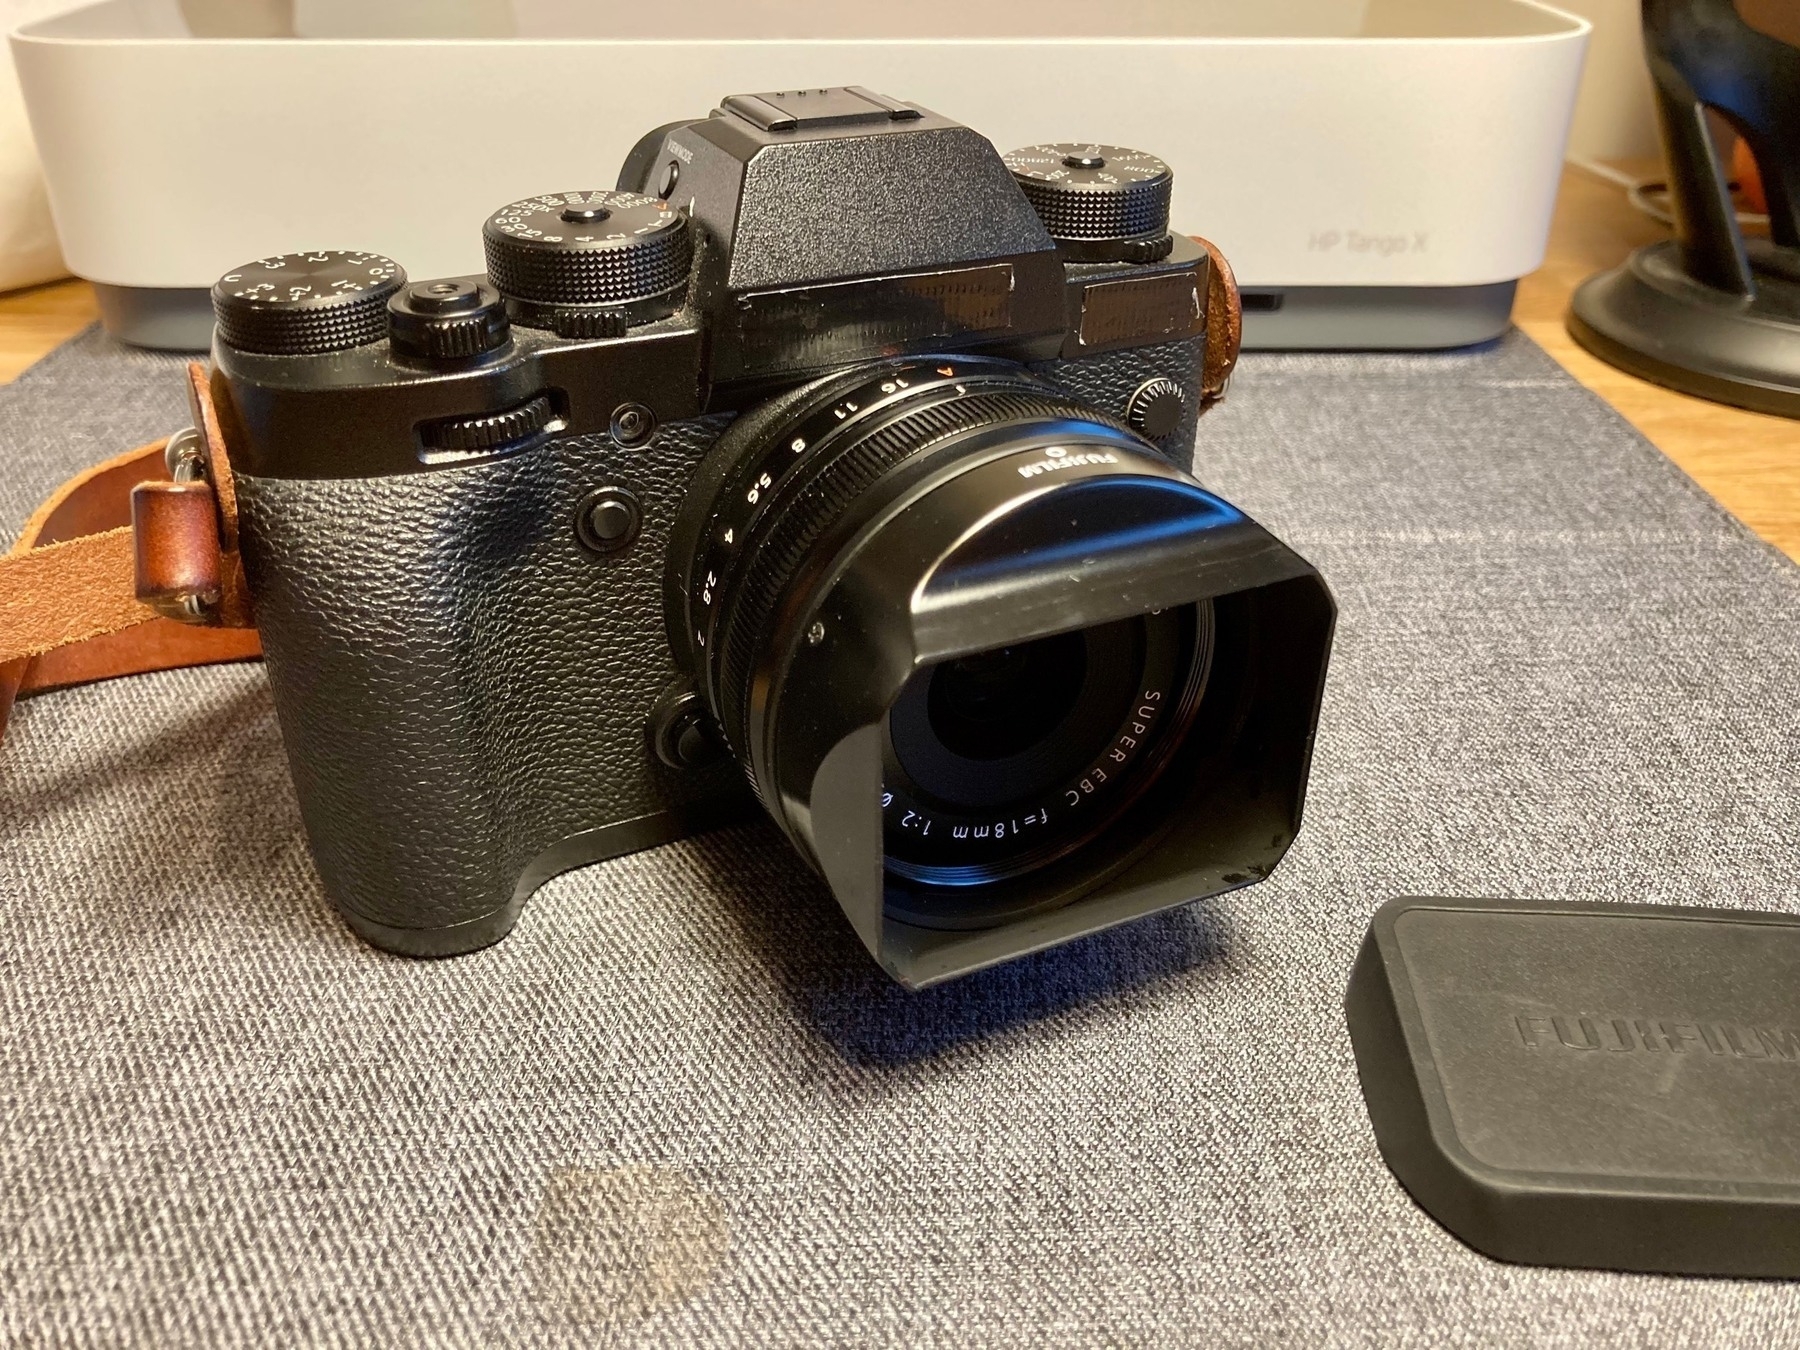
Fuji 18mm f/2 arrived. They old presentation boxes and metal hoods are lovely. It also focuses fast enough for my kids running around so, as usual, the internet exaggerates any issues.
My favourite teapot
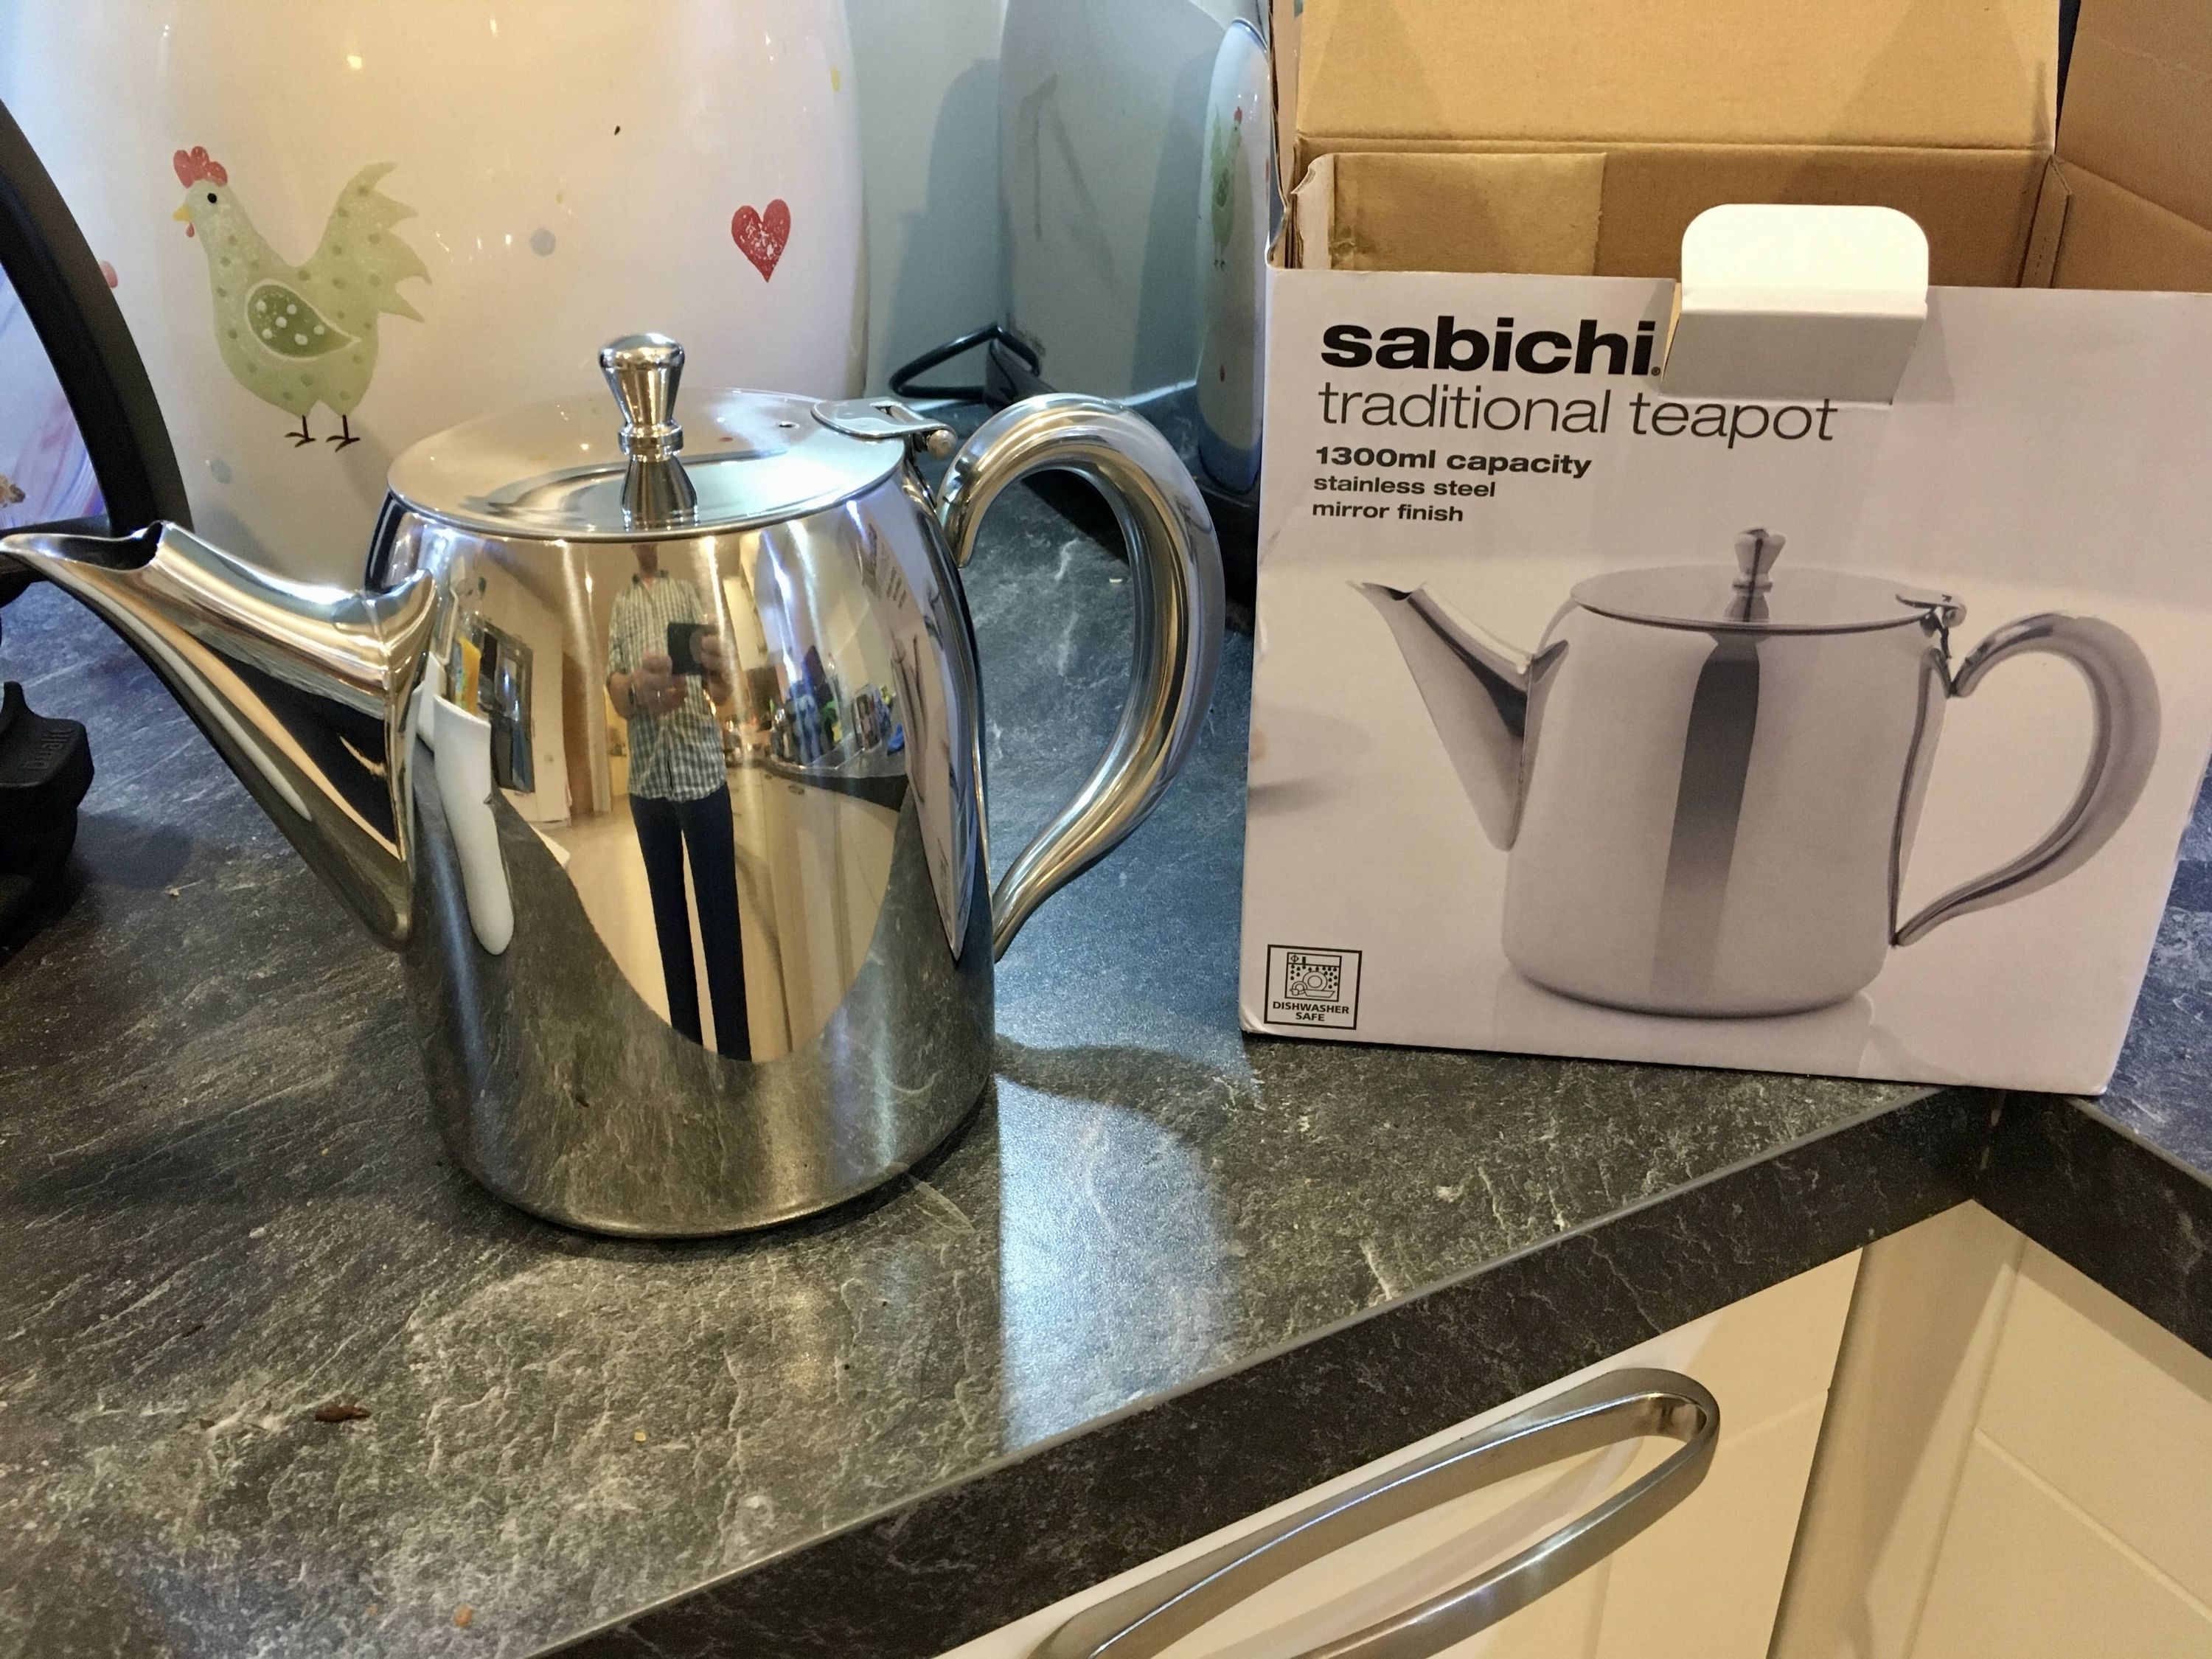 Sabinchi teapot and box
Like all favourites the real favourite always depends. It depends on the intent, at least for me. I suppose you could do a “of all time” or “best overall” style favourite. I think a common distinction is form over function. There are a lot of things that look great but are practically useless, even if - like a teapot - they should be used, they still may remain annoying.
So having said all that…I present the Sabichi classic stainless steel teapot.
It comes in a variety of sizes 720ml, 1300ml, and 1900ml, so big enough for even the largest tea drinking family. It’s also very reasonably priced at £16 for the medium sized one.
So why do I like it so much? It does the job very well: It has good capacity, it has a classic, timeless look and most importantly, it pours well. So many teapots have terrible spouts that drip or splash tea everywhere. I enjoy filling it up with 1.3 litres and then having several good sized mugs of tea. A teapot for one is fine but when visitors are around you don’t want to have to decide between a teabag per mug or tiny cups to use the tea pot.
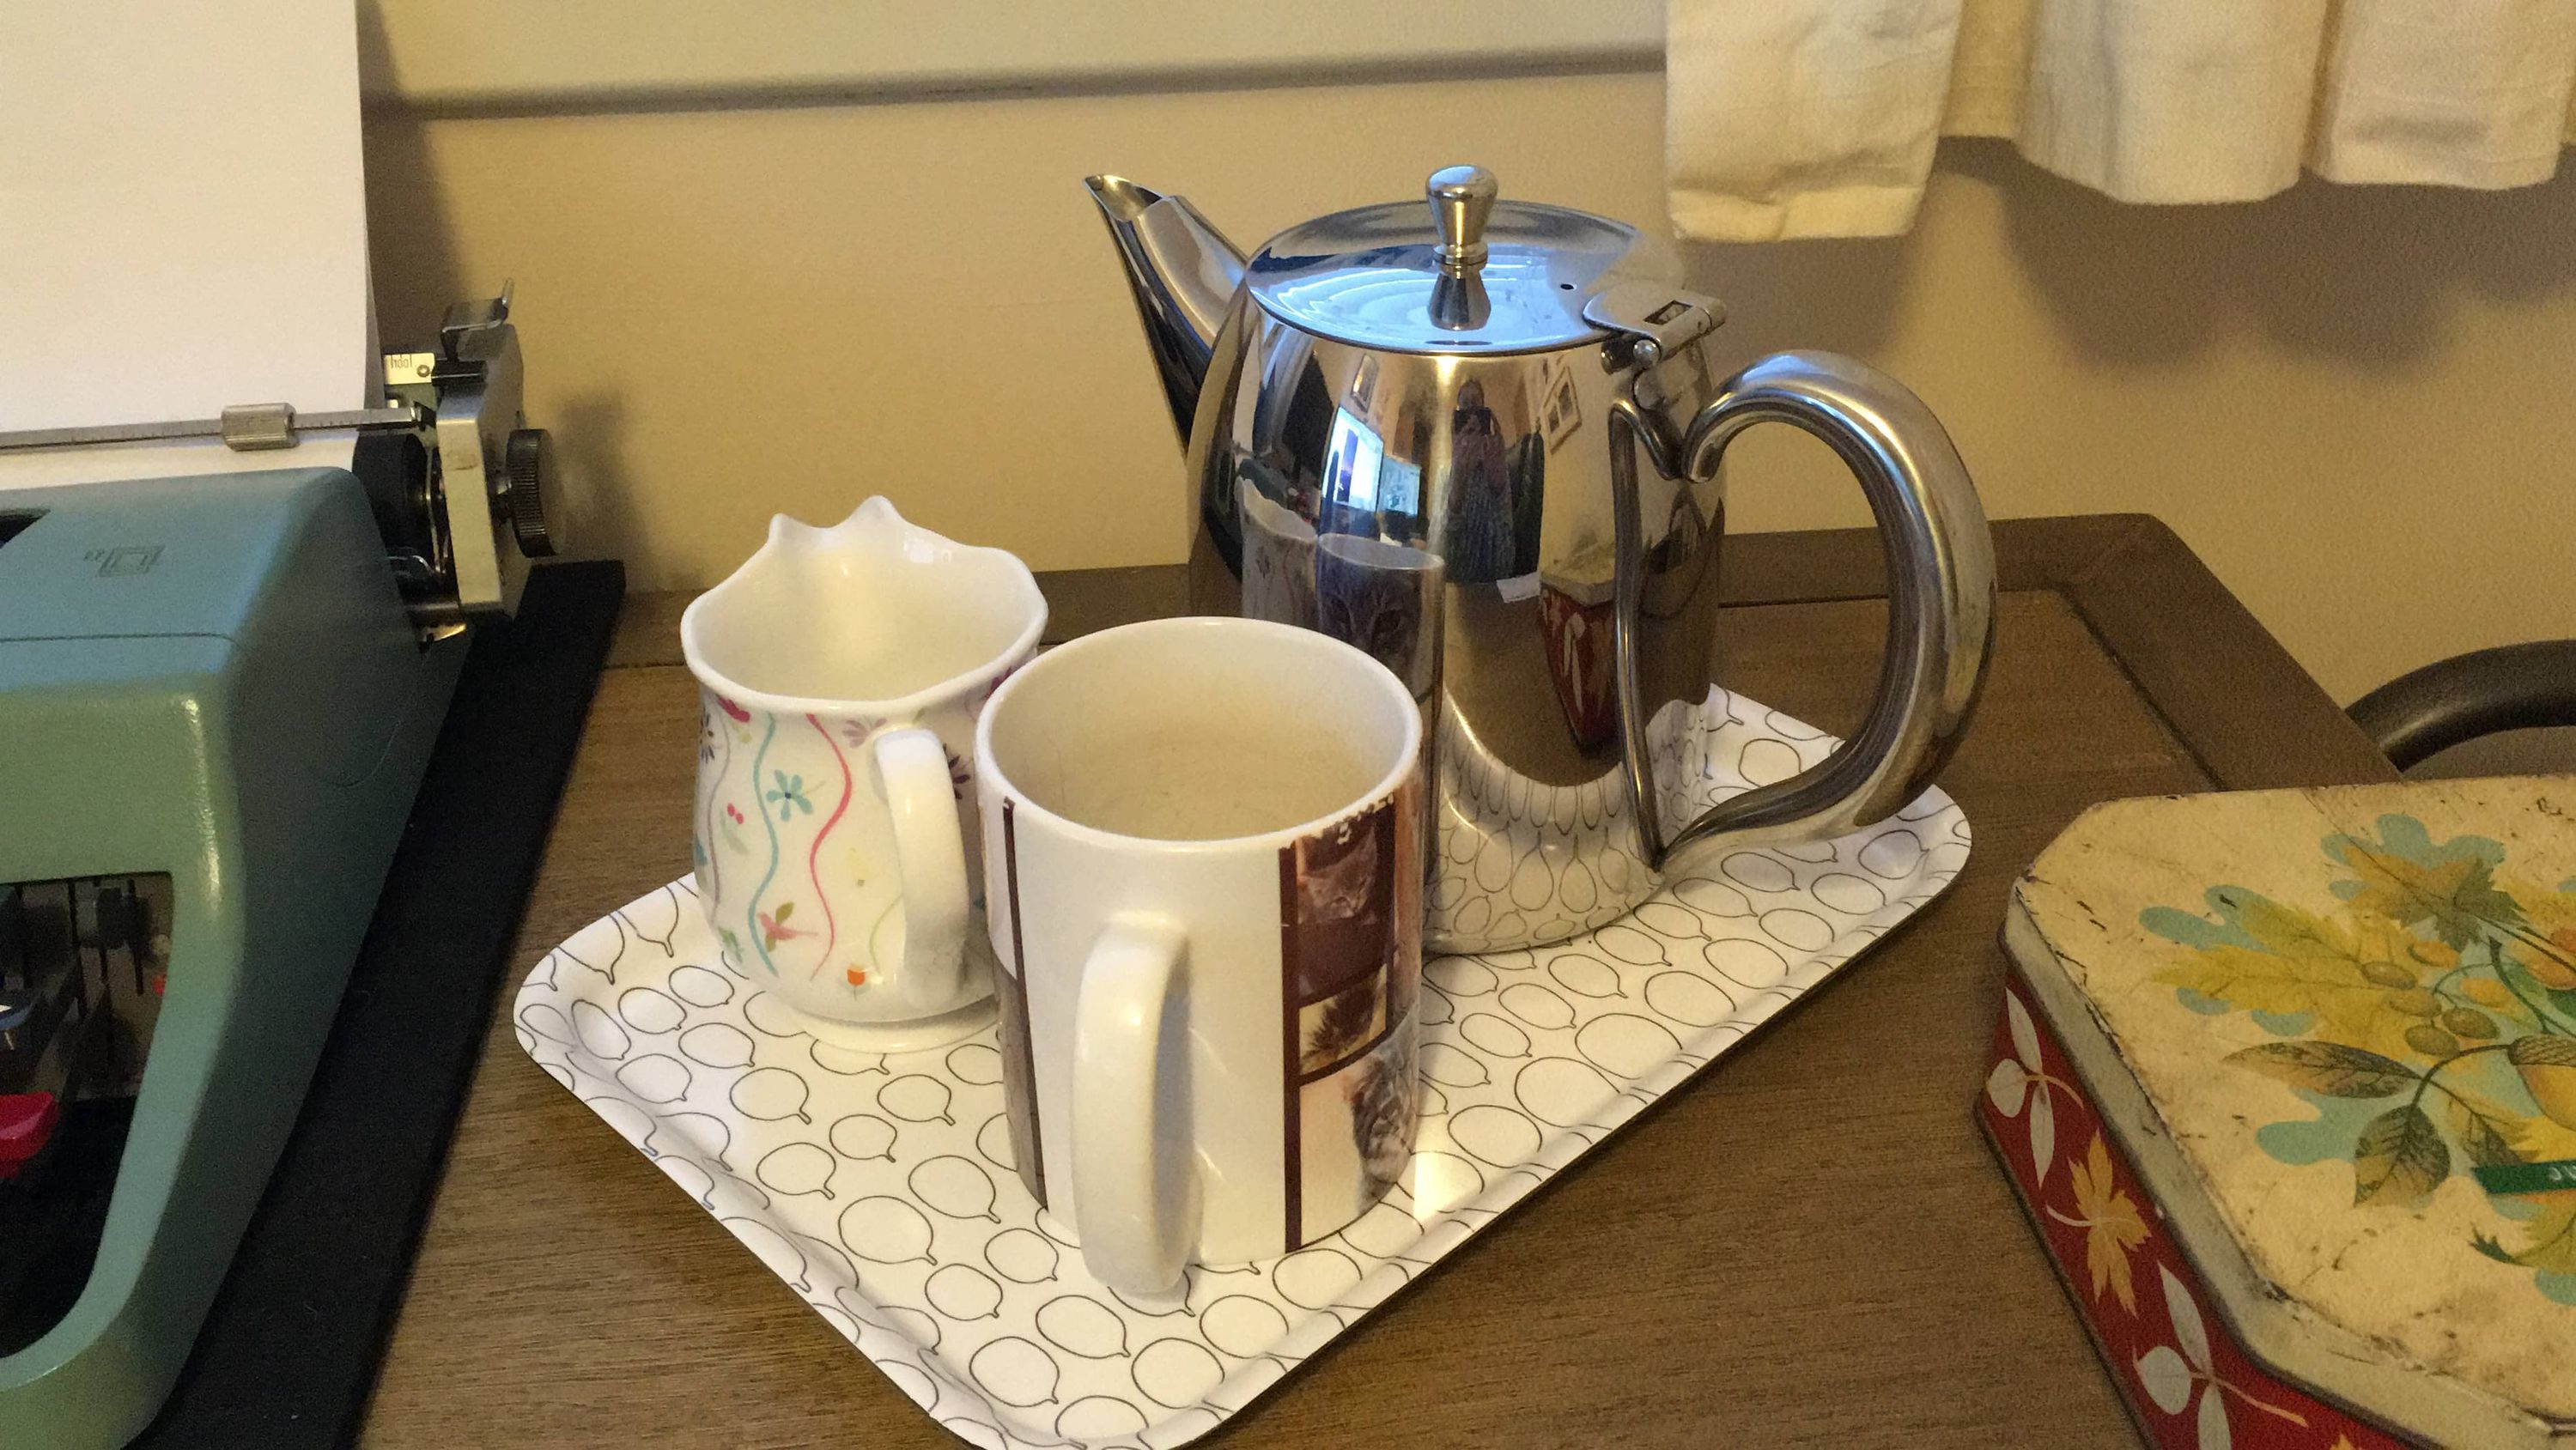 The joys of working at home
It has been perfect for working at home when the children are also home. I could make a good amount of tea and hide away in the office working, and not be worried about coming out and upsetting whatever is going on because I’m parched.

I just worry that I should maybe buy a spare in case this one breaks…
Hmm my tiddlywiki stopped adding the created field to new tiddlers…which then breaks everything 🤨
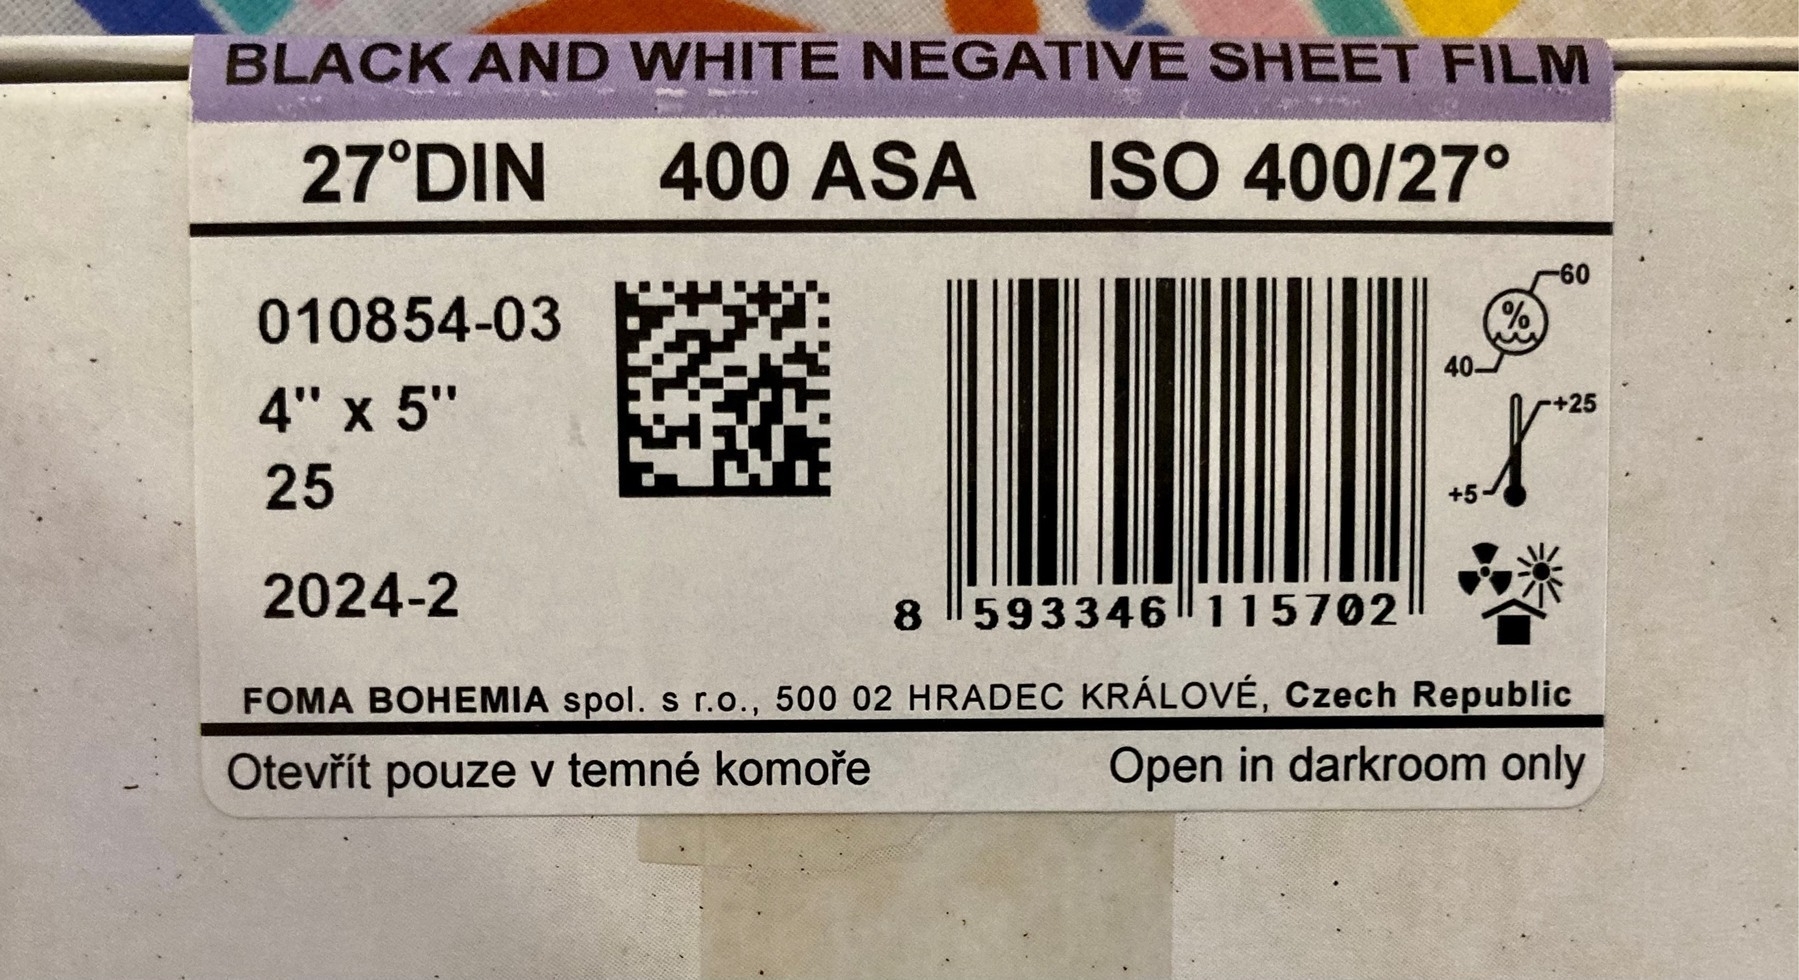
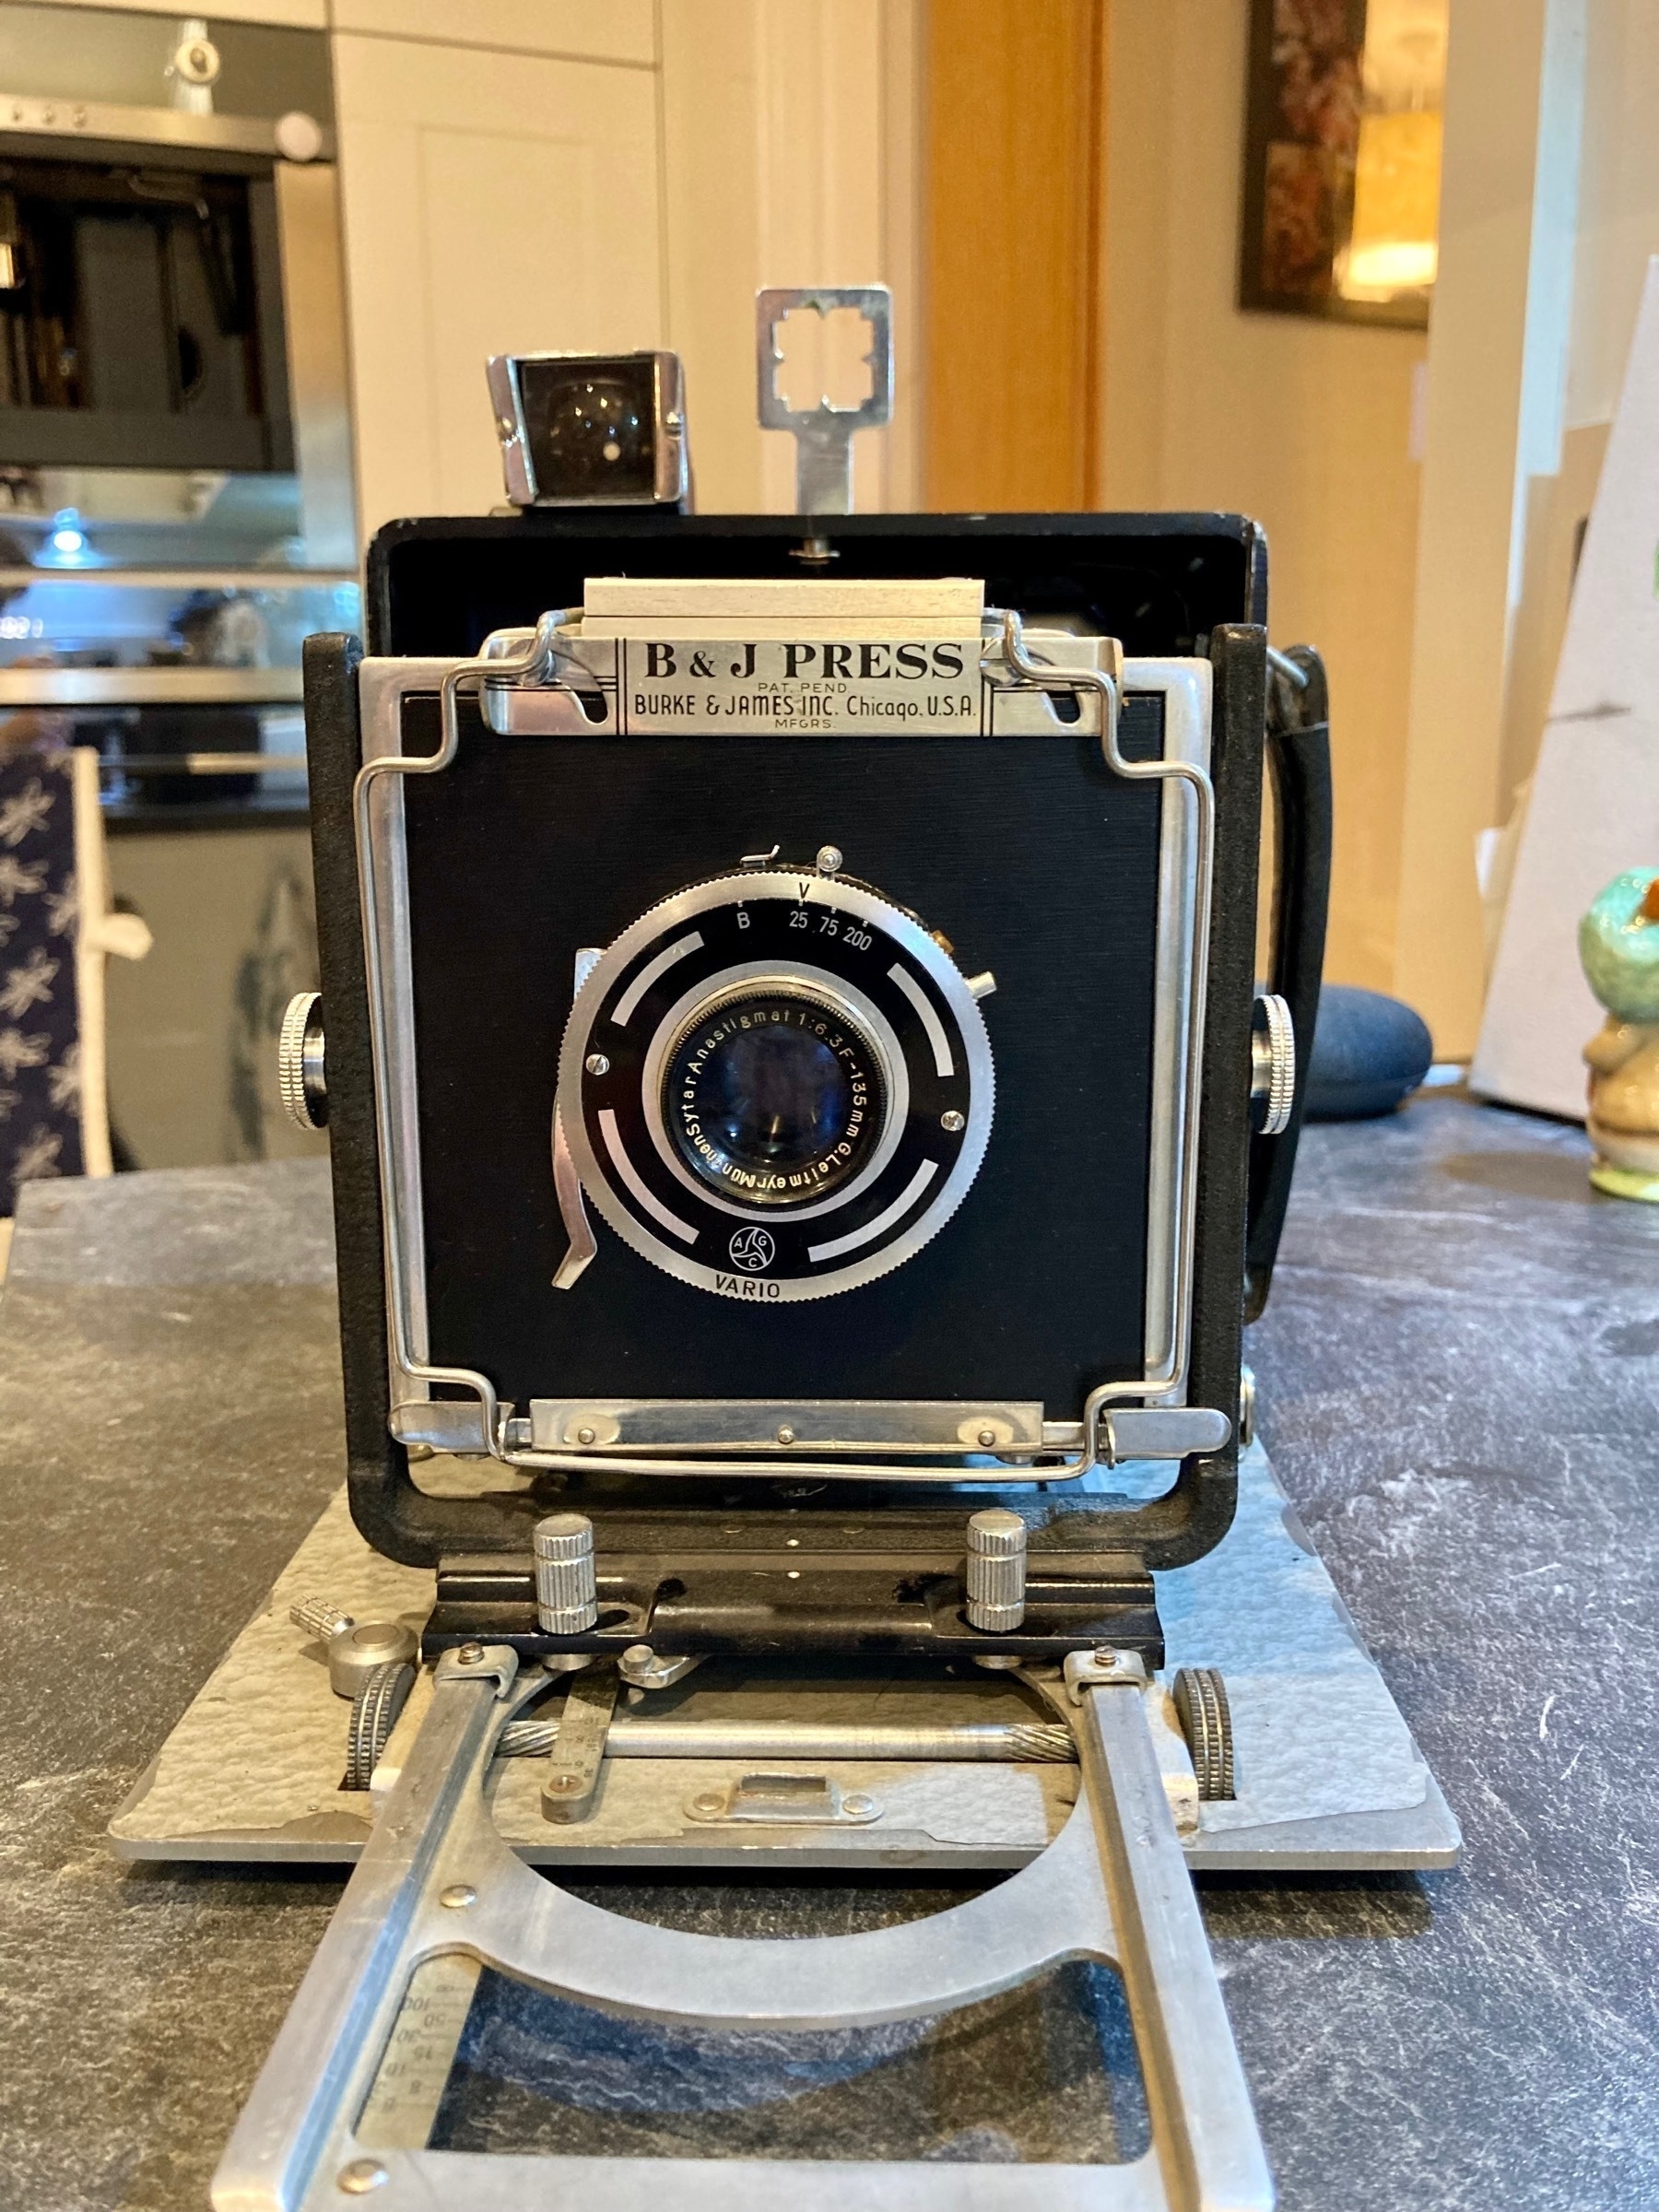
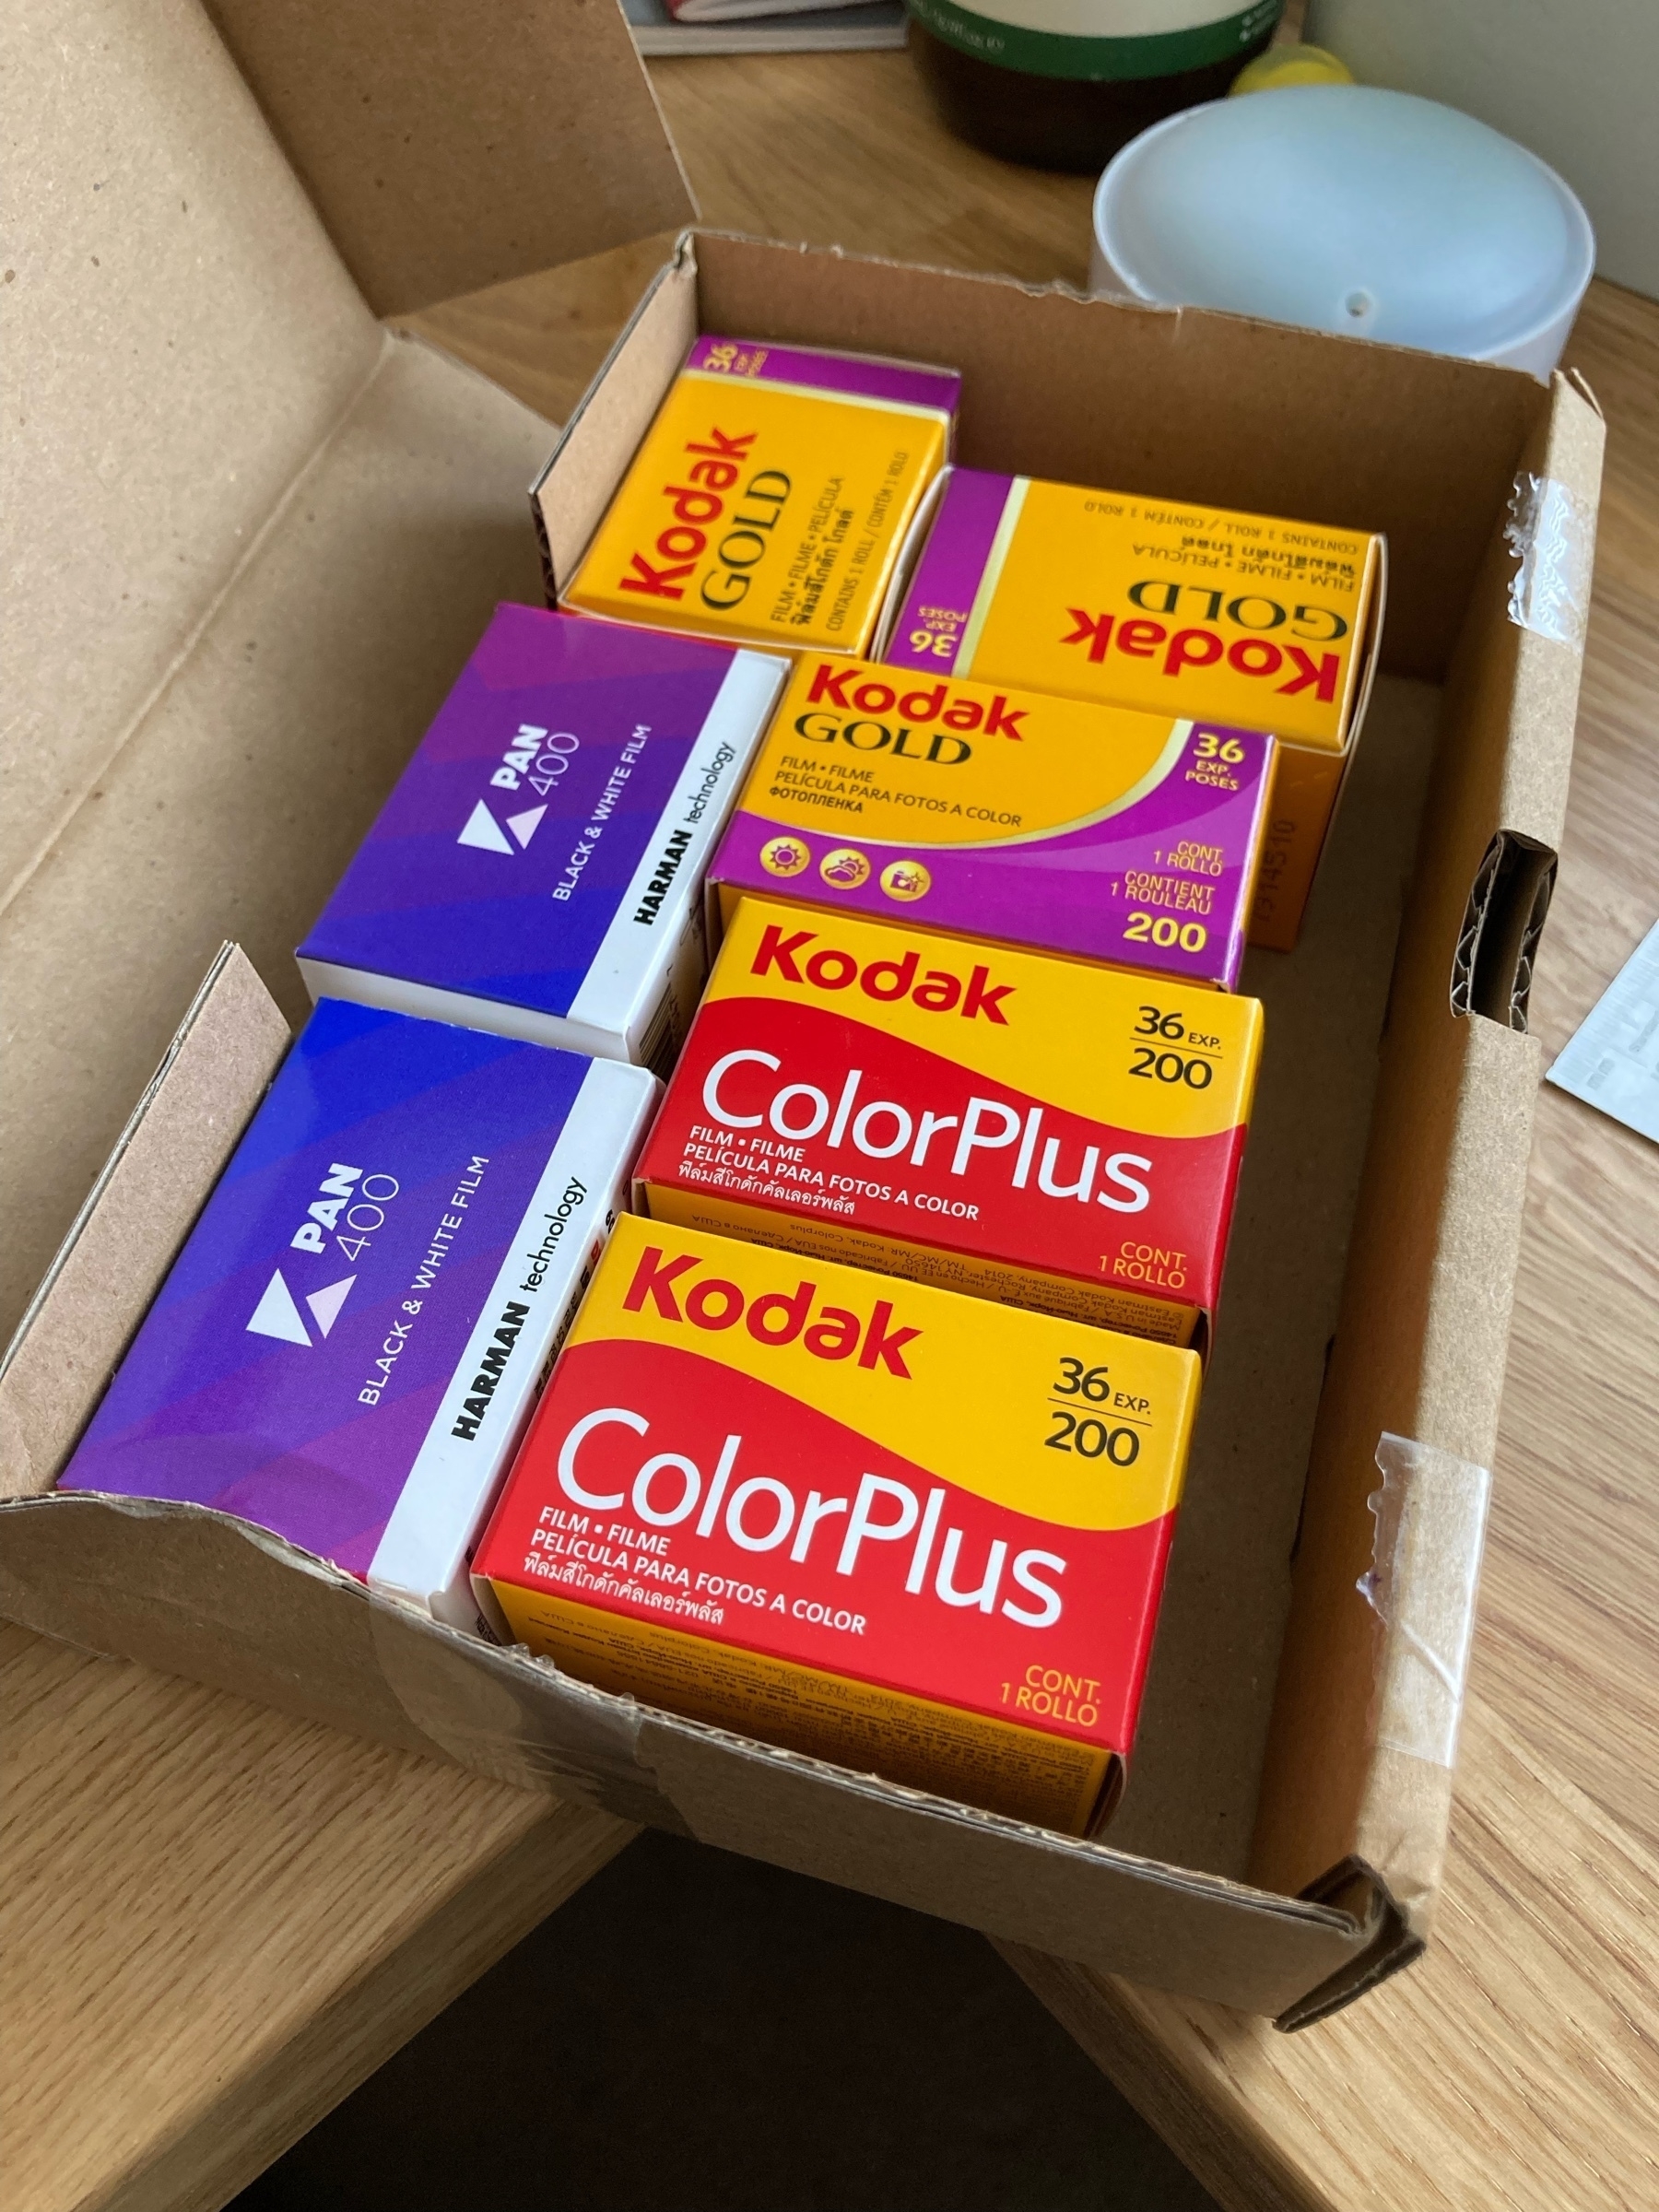
Cheap skate film day.
I haven’t used this pen in years. Maybe 10+. Always preferred the convenience of cartridges. Been using it everyday for work the past month and it’s lovely. 🖋


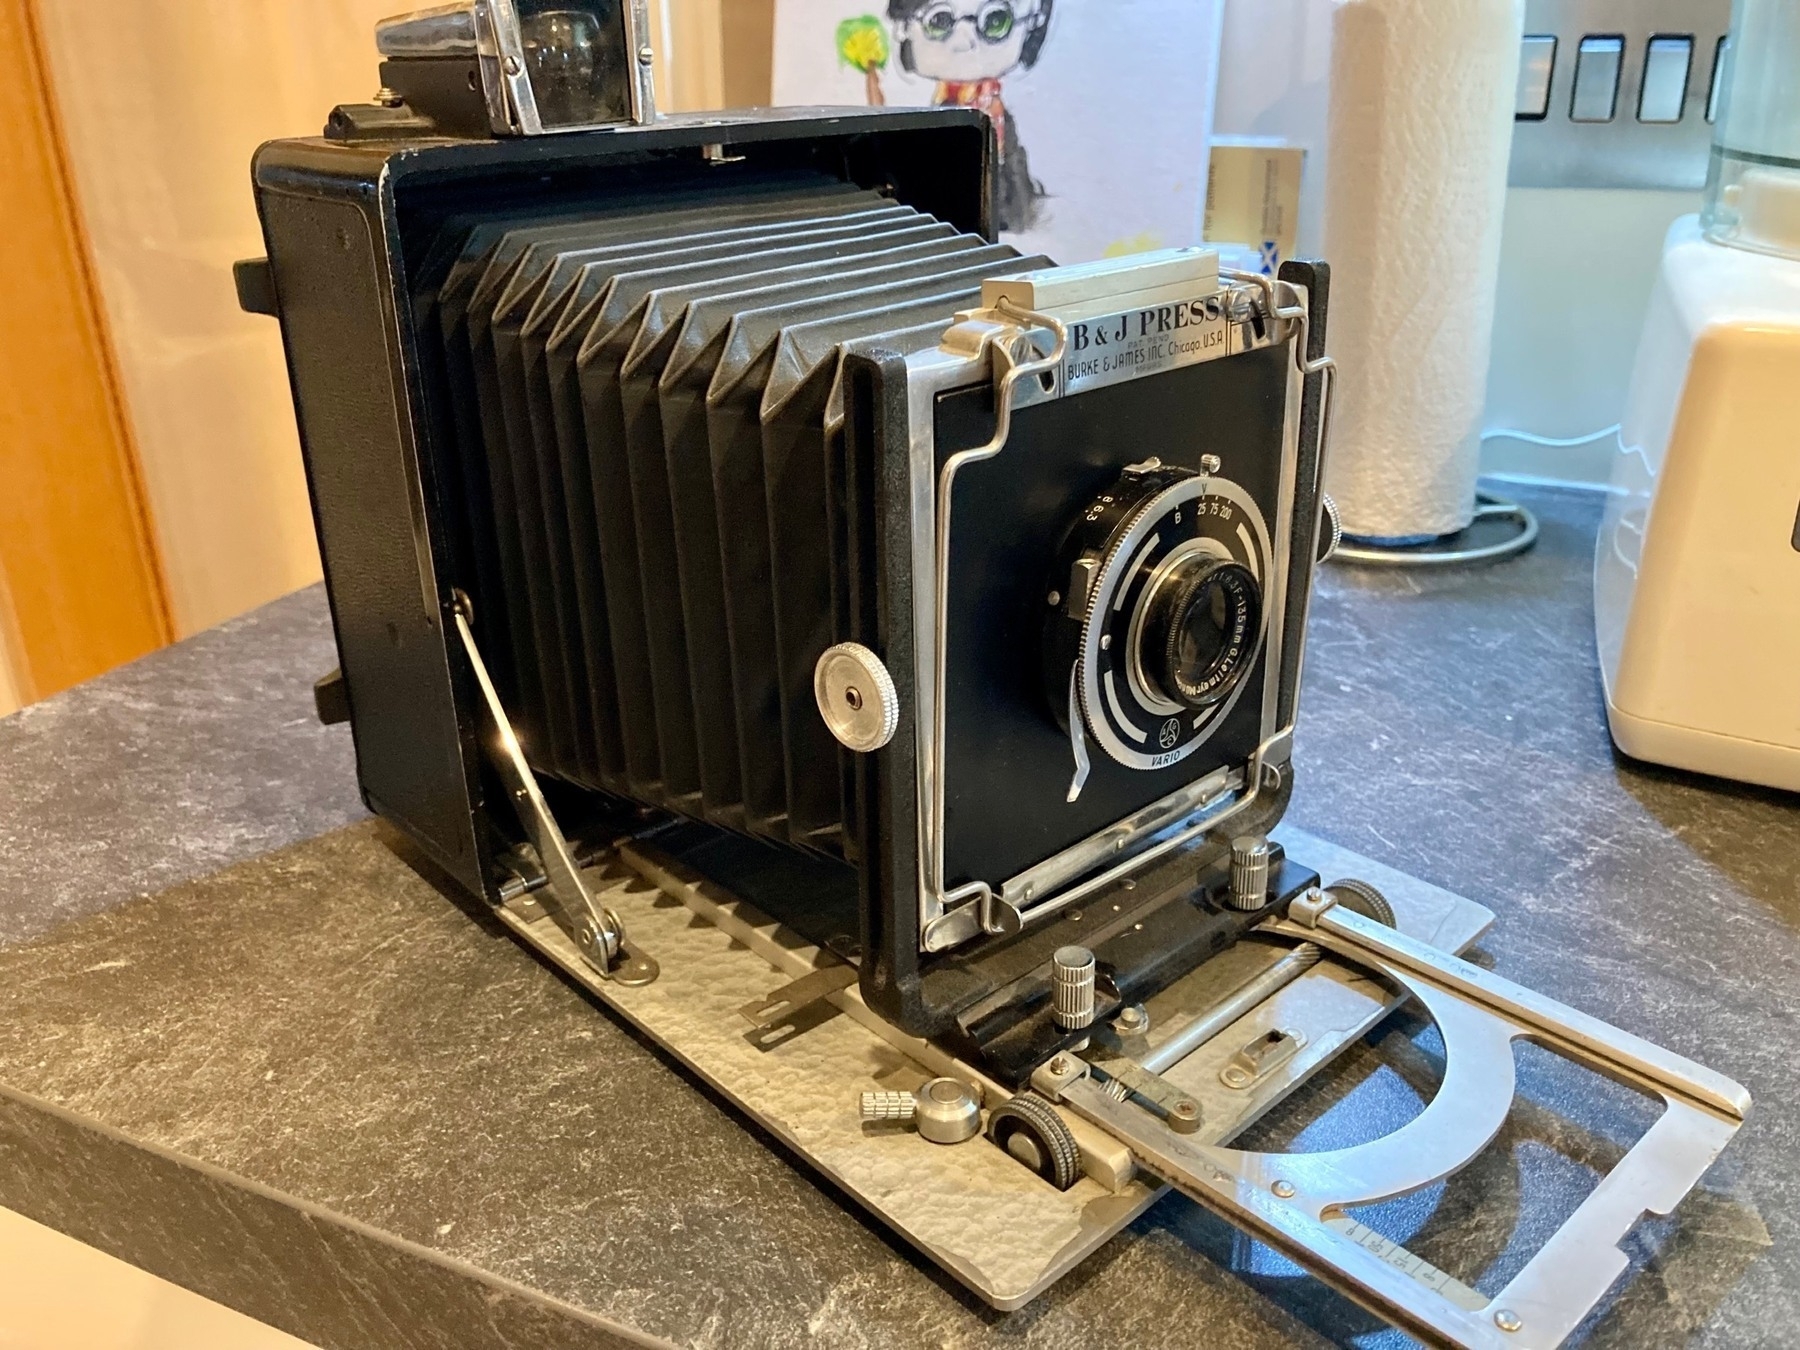
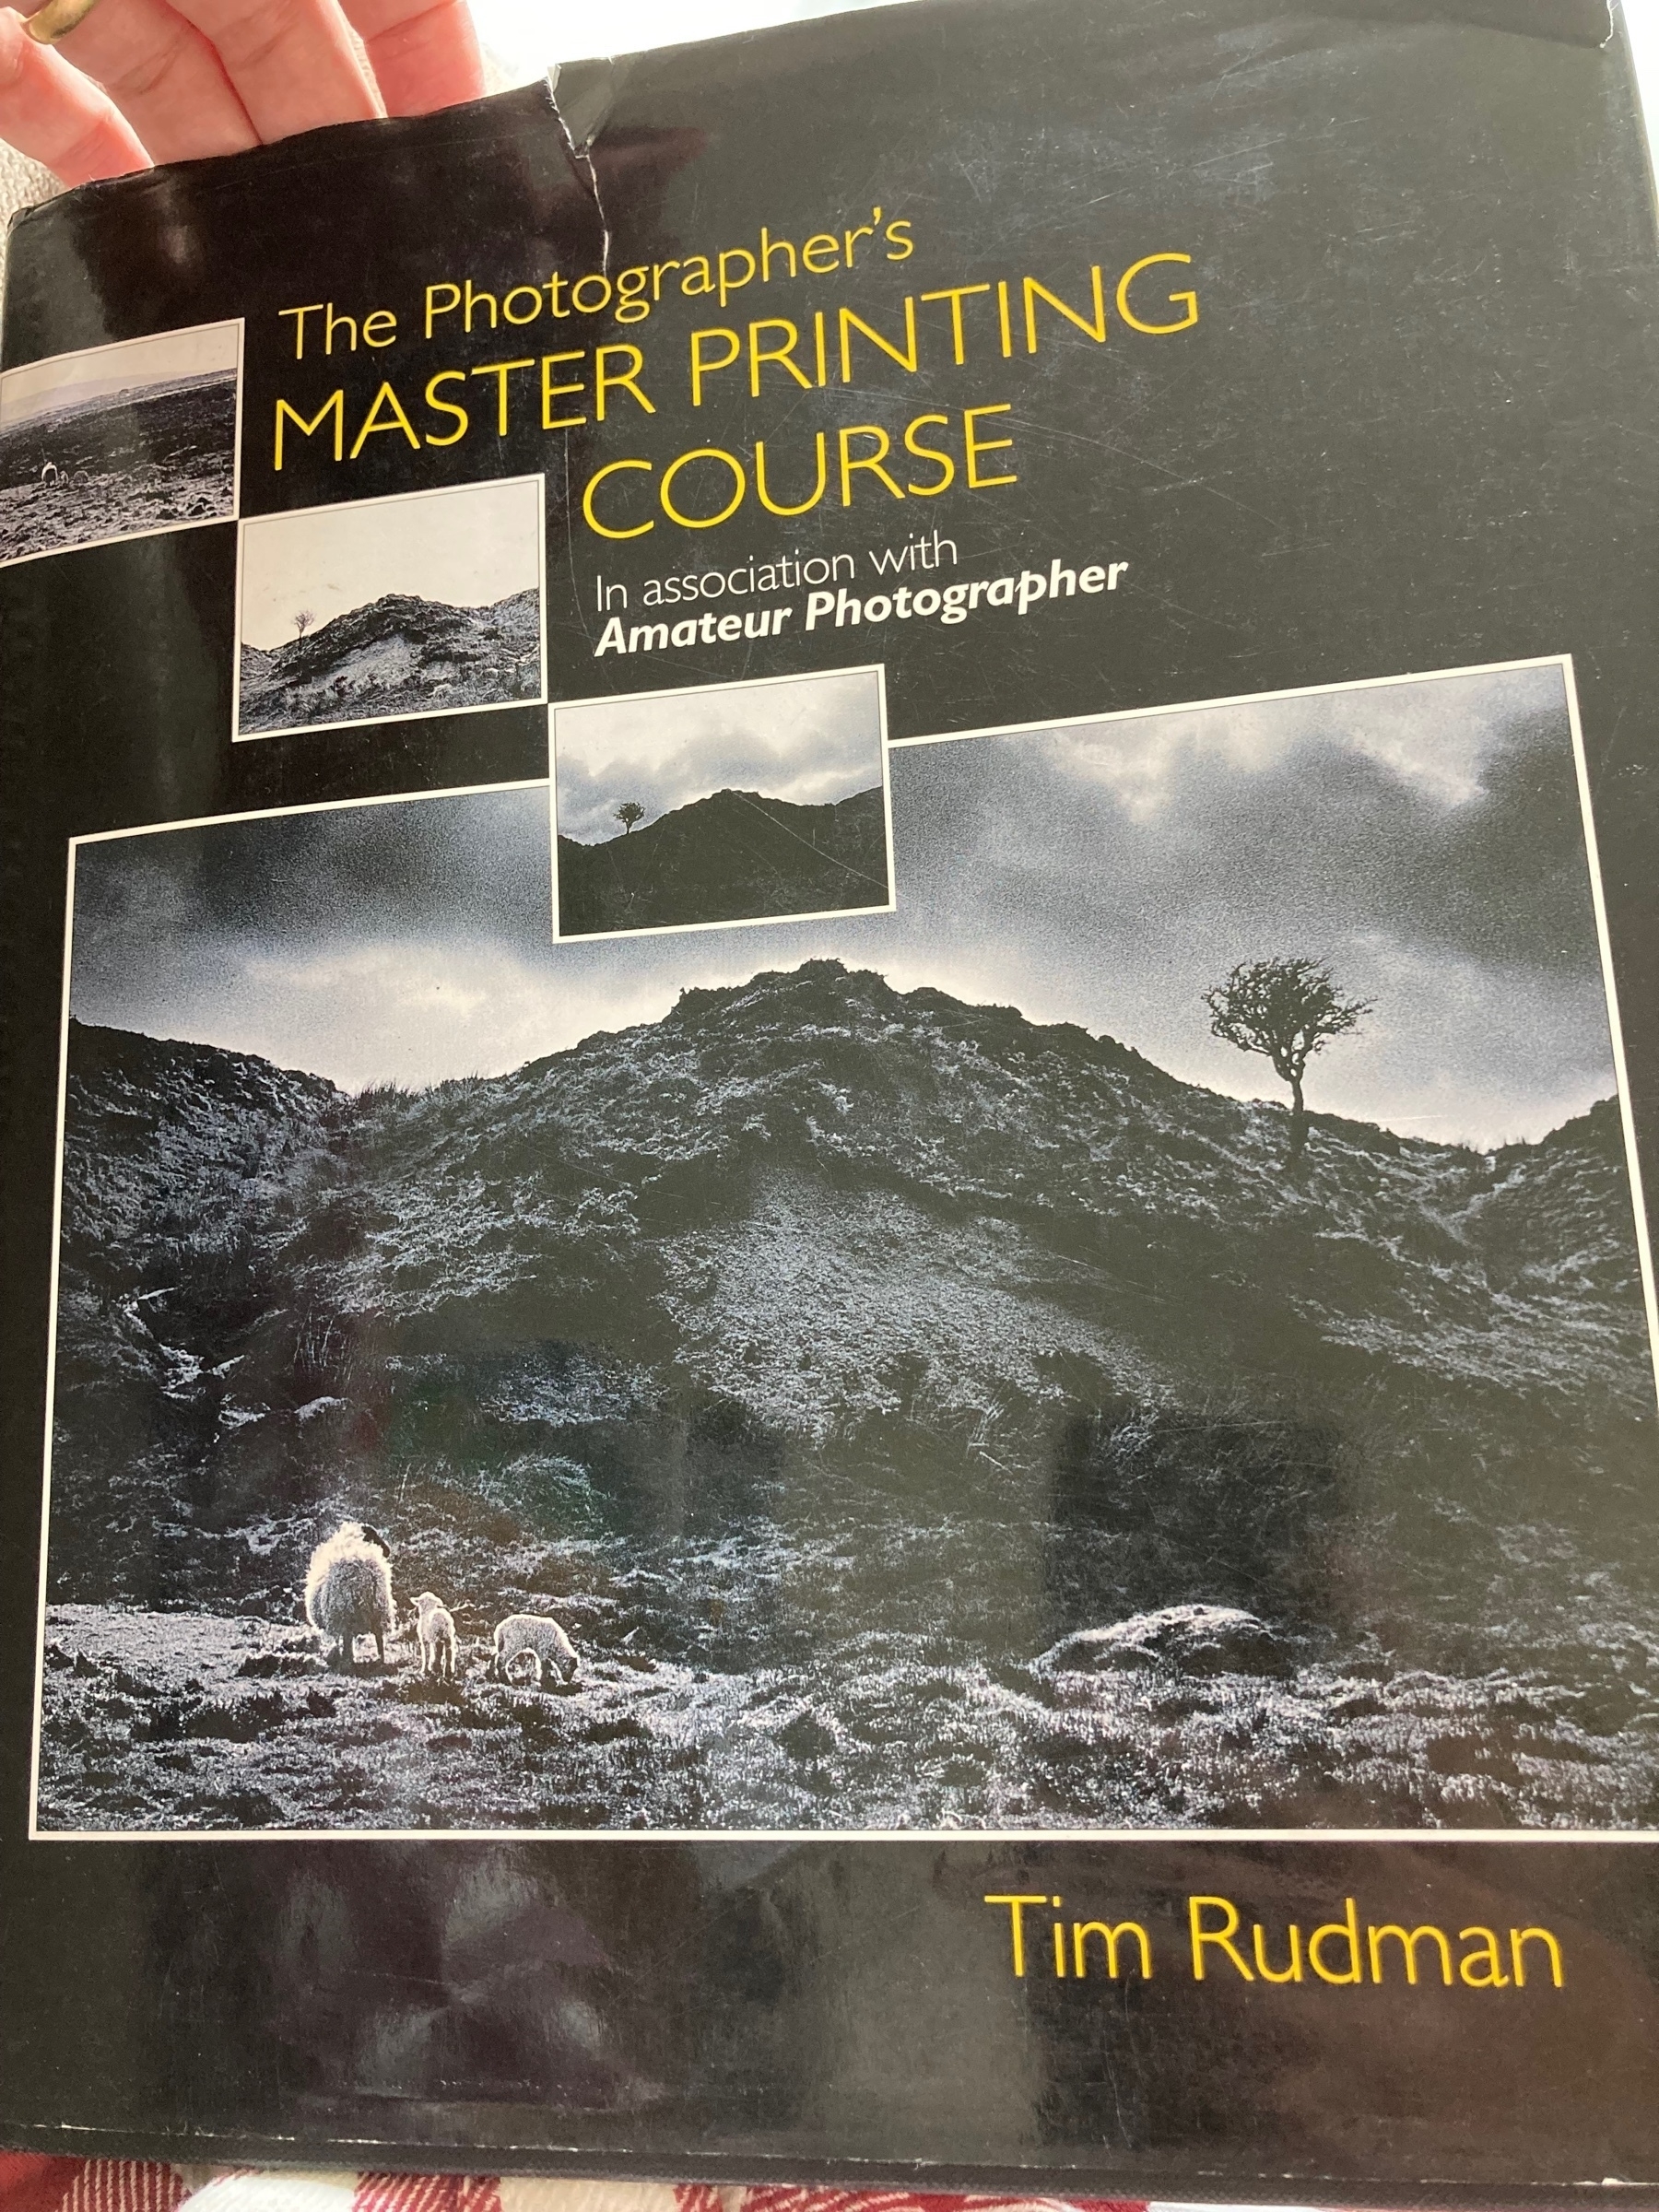
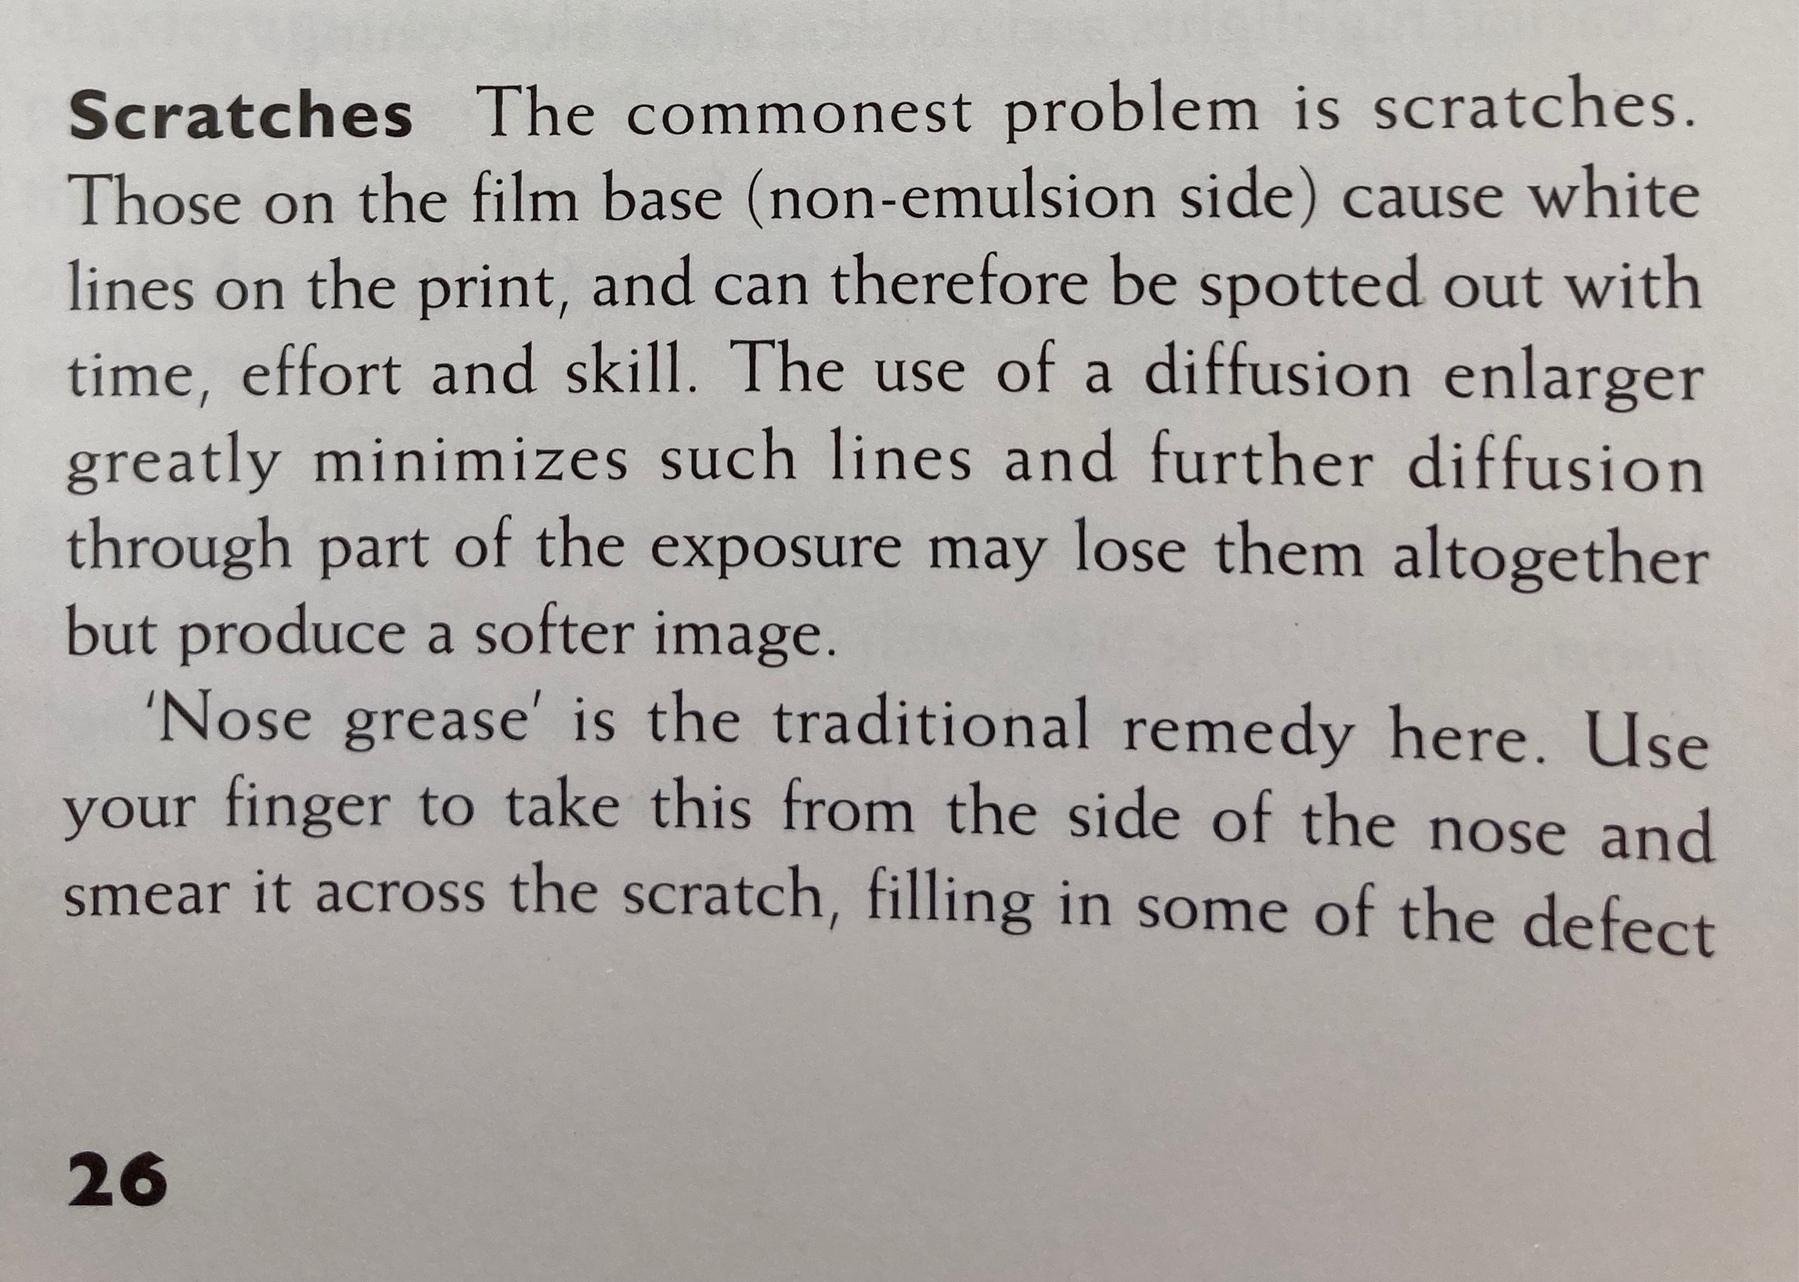
Reading through Tim Rushton’s printing book and came across an interesting technique for removing scratches on film! 📷
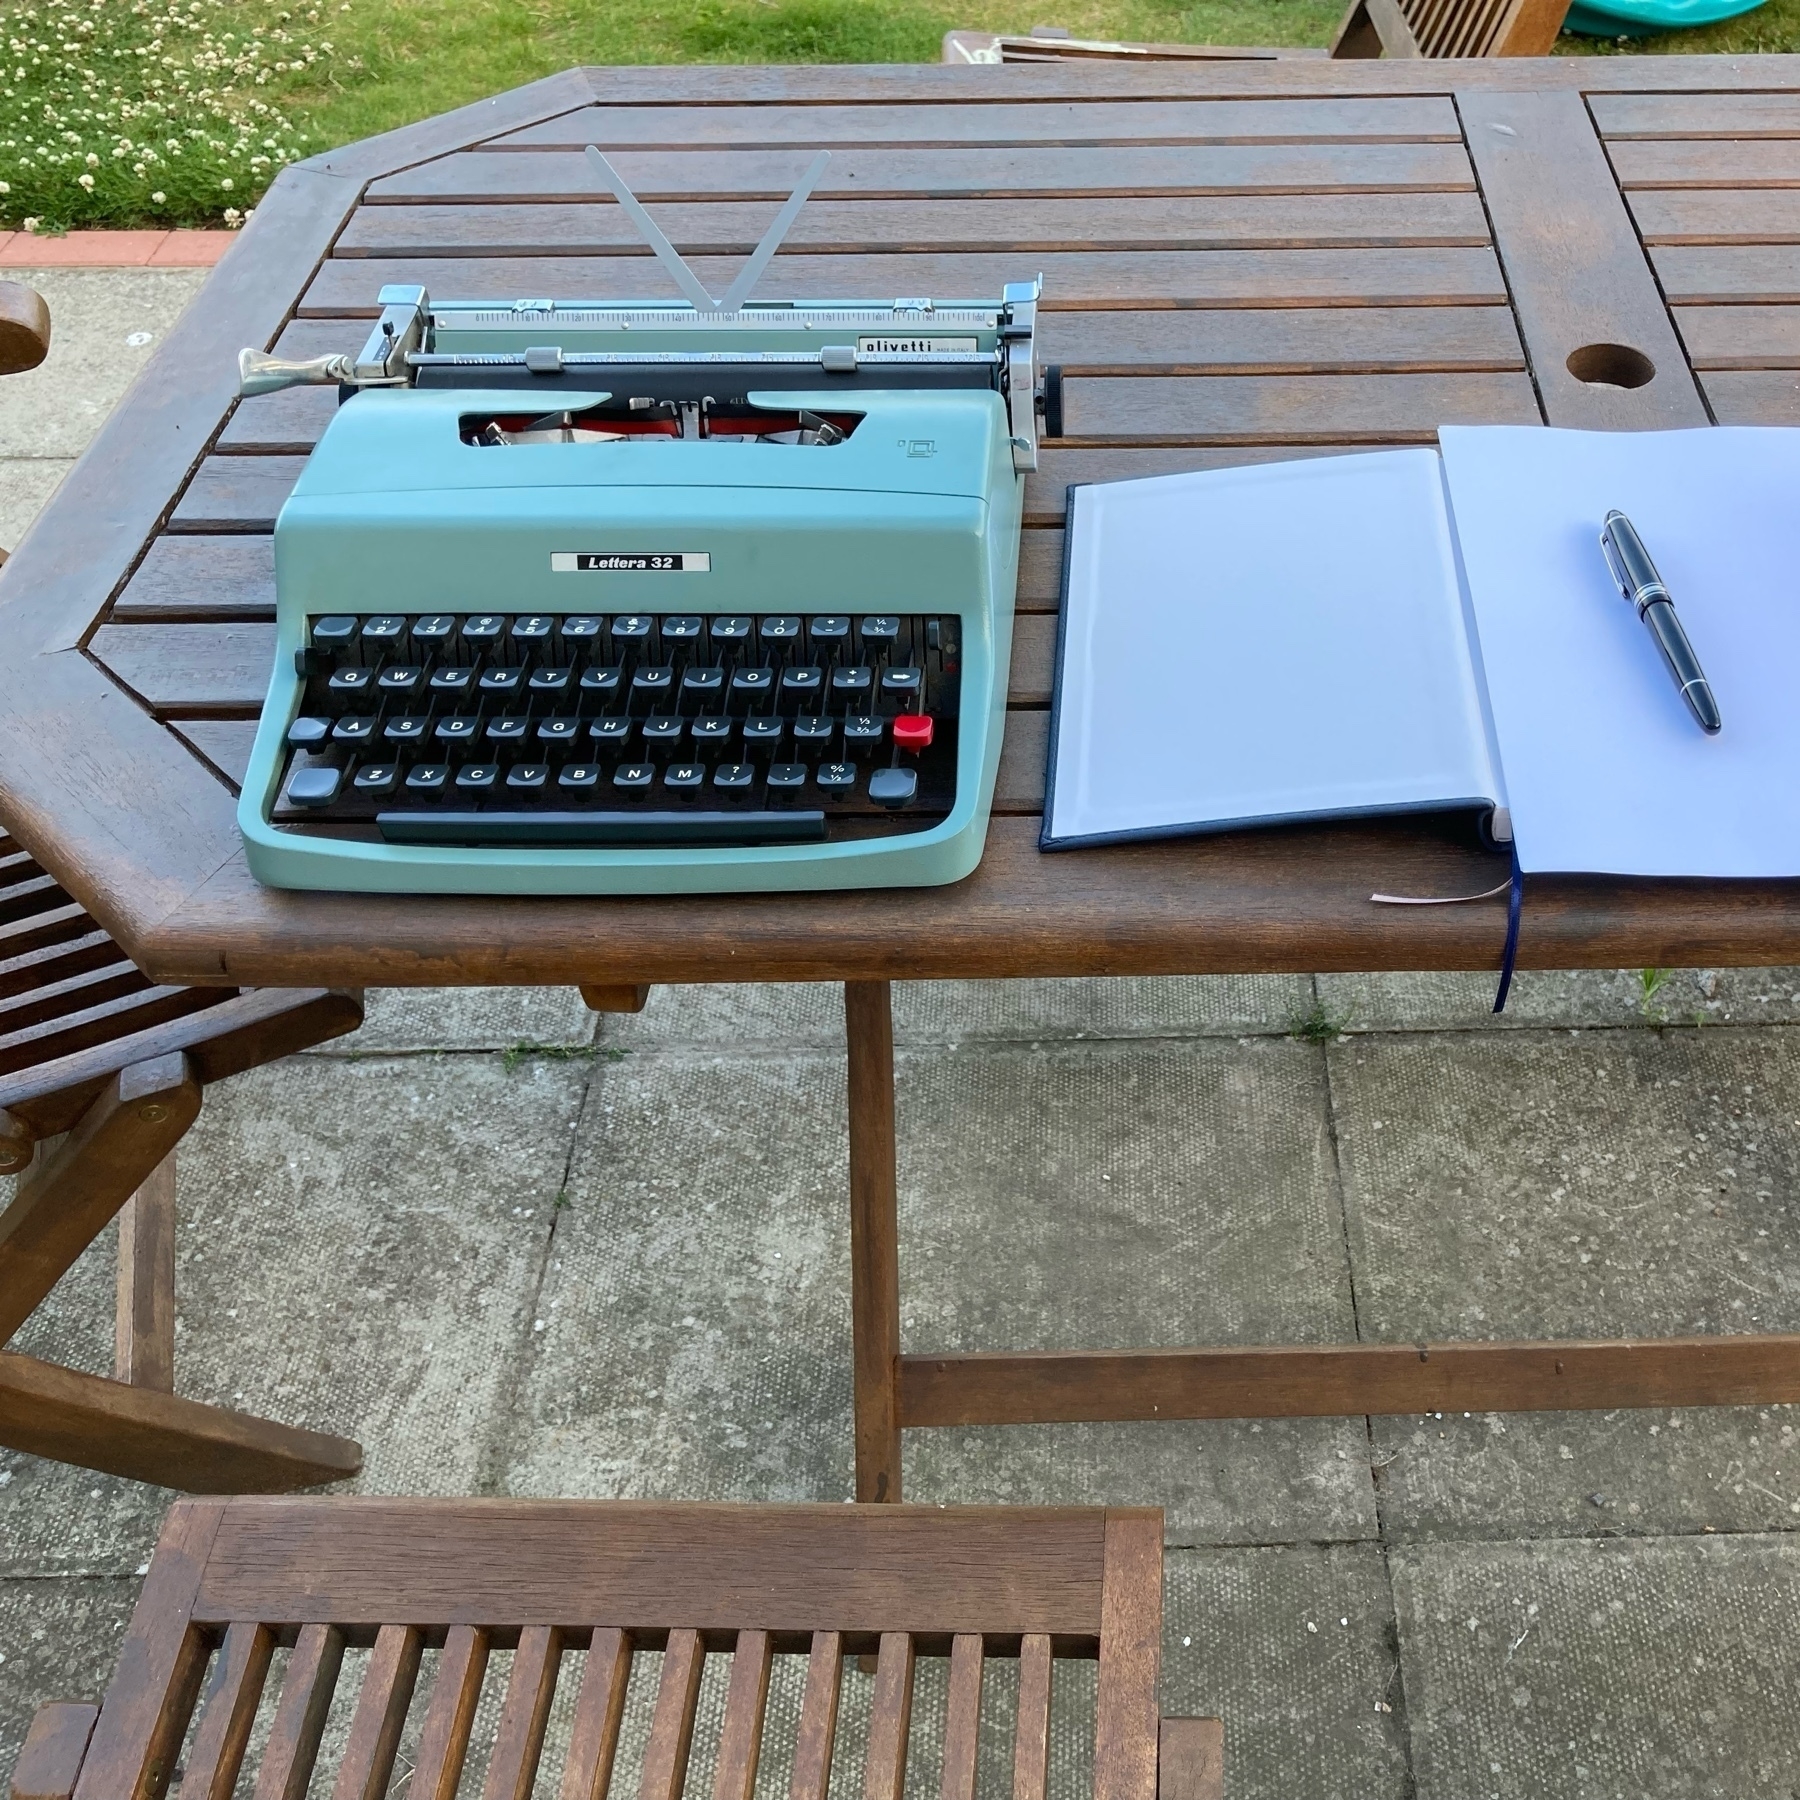
Lovely evening weather for writing a letter. 🖋
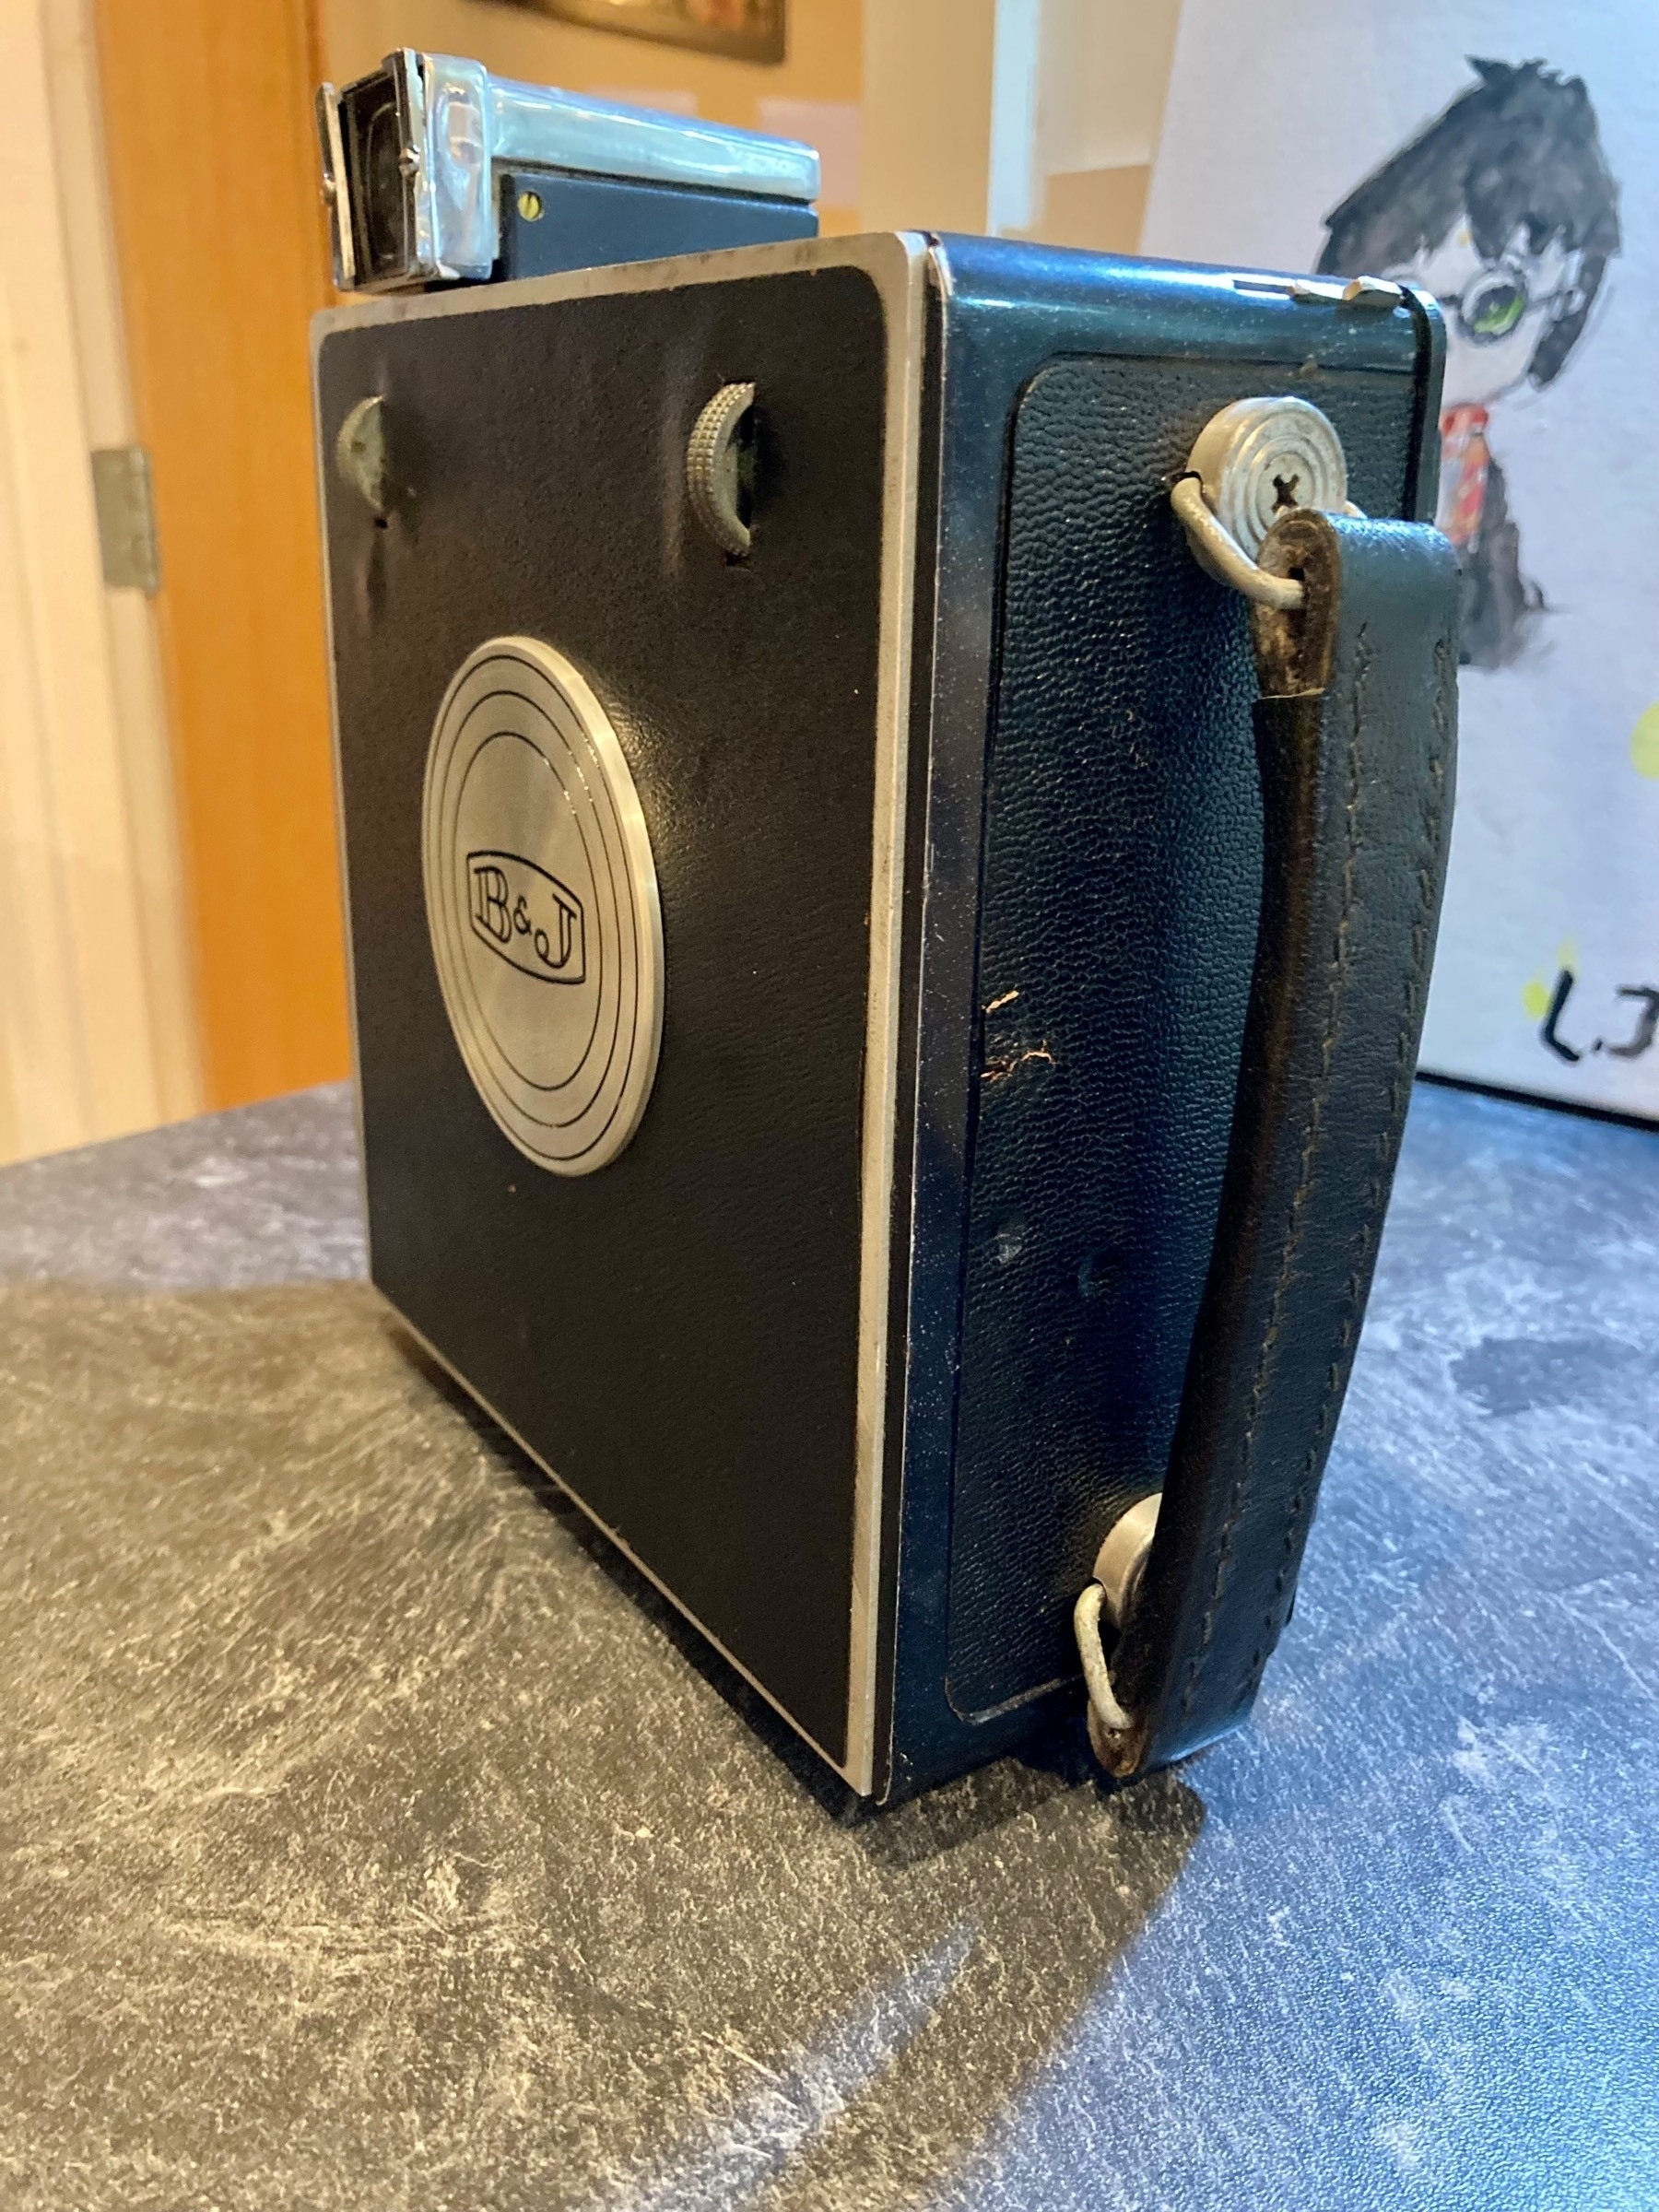
Film fun 🎞📷


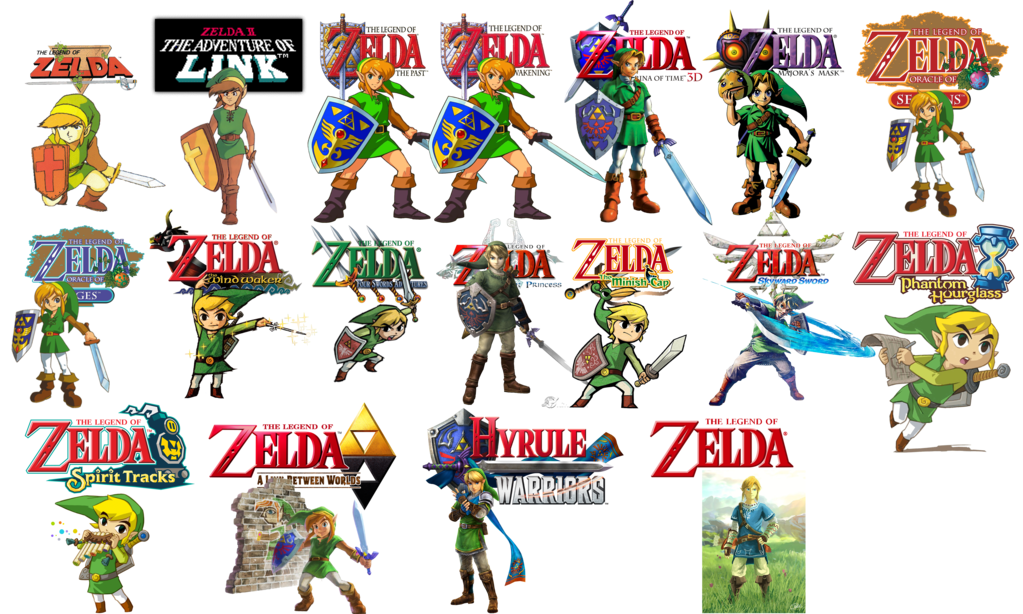
Playing all the Zelda 🗡🧝♀️
The Legend of Zelda: Skyward Sword HD is out on 🎮 Switch. But what if you want to play ALL the Zelda? It’s actually not too hard (ignoring the hours of gameplay), thanks to the amazing 3DS and underrated Wii U:
Wii U
3DS
When BotW 2 comes out then you’ll also need a Switch.
Grandfather’s slides from living in Kenya in 1962
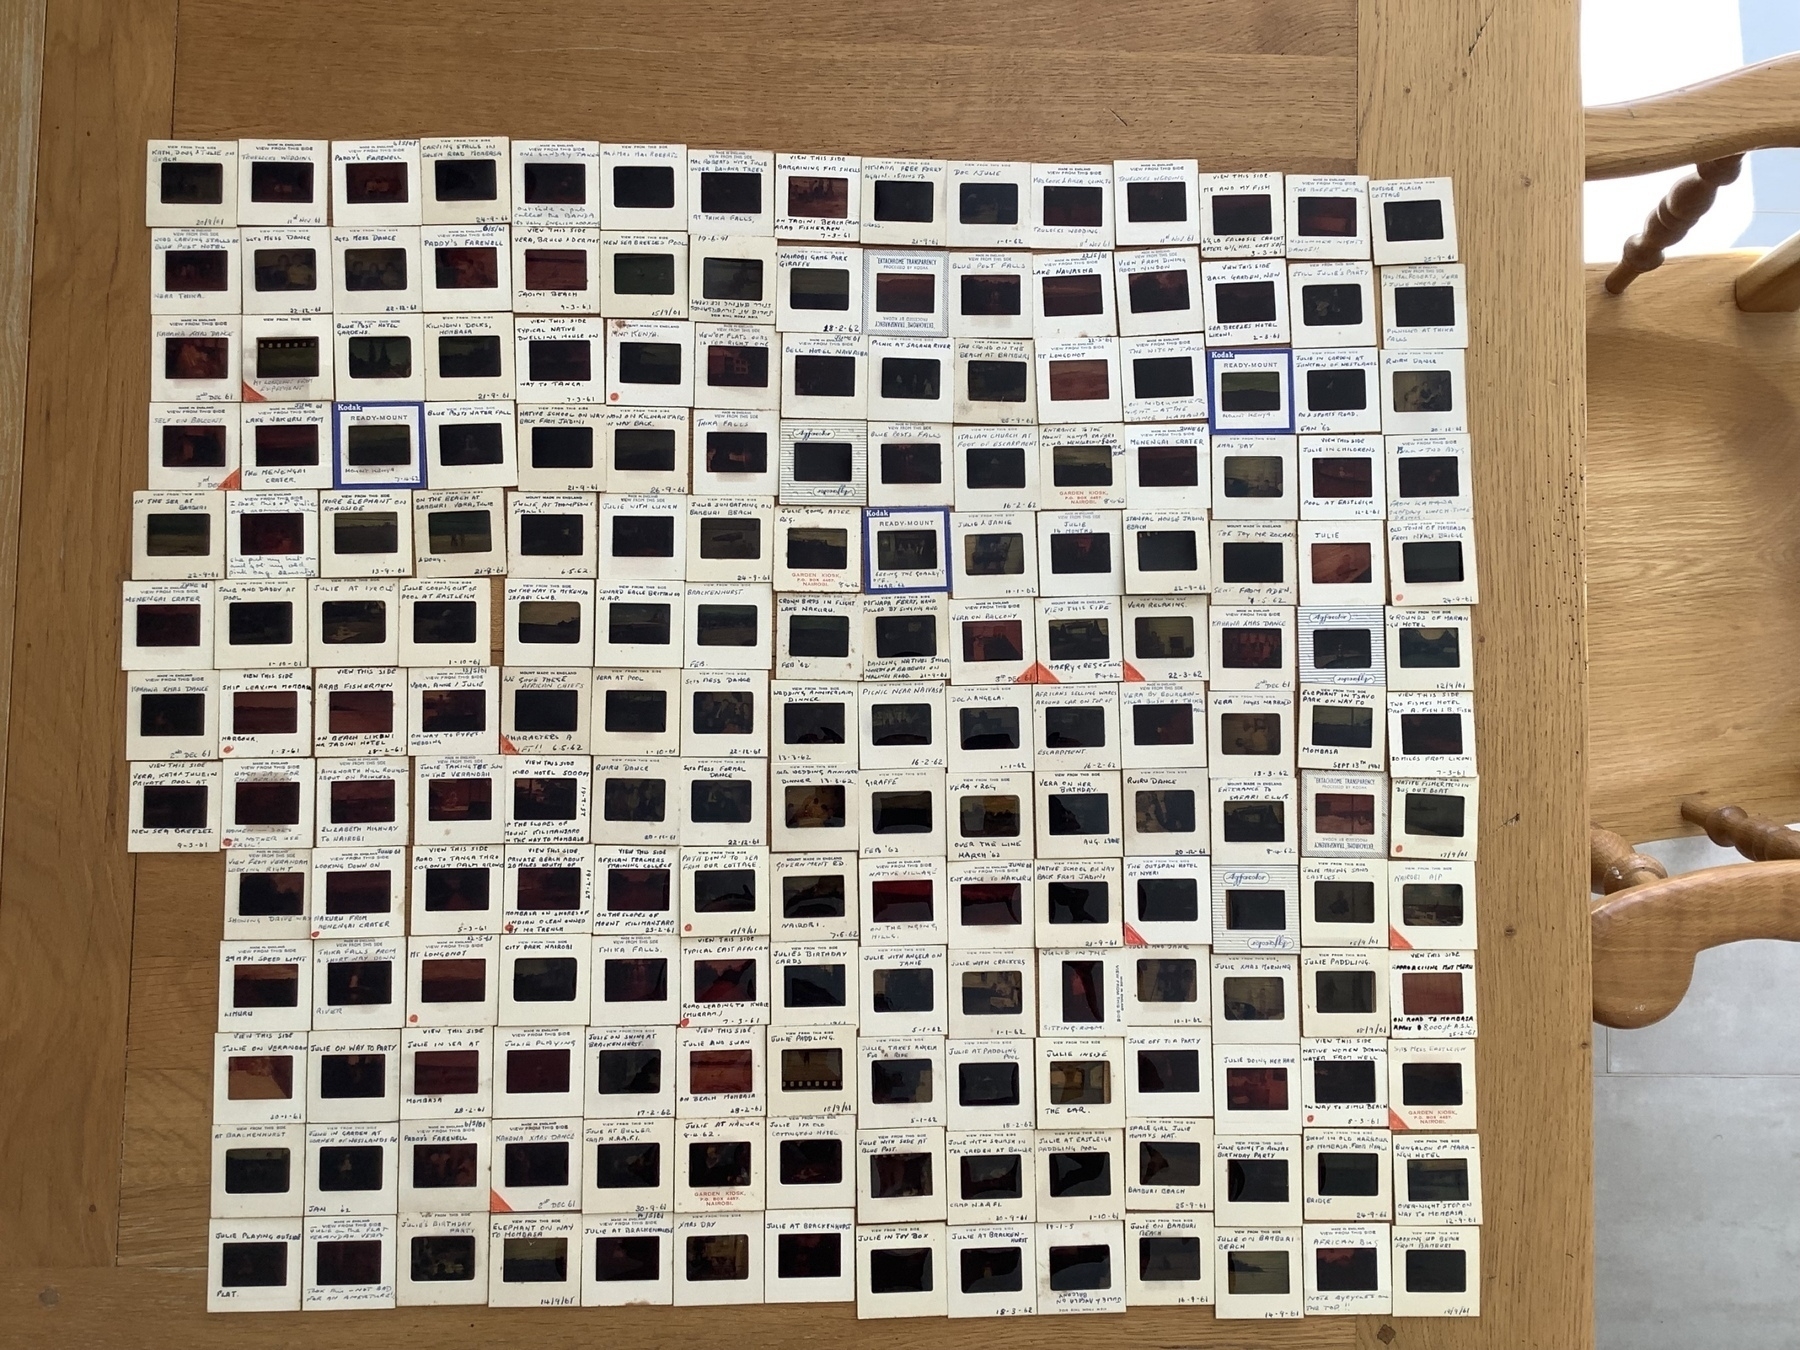
Scanned and making a photo book for my mum. You can see the slides here. 📷
Hi! Round 2. Here's hoping it'll last.
It ended with an annual subscription to micro.blog. (Better than monthly as (a) cheaper over 12 months, most importantly (b) will keep me incentivised longer to establish the habit.
Although, perhaps it’s starting with the subscription. 🤔
As you’ll see from the post history I started this blog last year and used it for the trial but then decided not to continue. The contents of that post are exactly true today and effectively the same journey I’ve relived the past couple of weeks. After reading Atomic Habits, I realised that I am a tremendous at being in motion and horrendous at taking action. Oh, the servers and scripts and build bots and configs and domains and clones and everything possible from Github would be tried and tested and hosted and tweaked. For weeks on end. But not a single word of content would ever get written.
I enjoy writing as a past time. I recently reopened DayOne, which I’ve had for years, and restarted the family journal. I’ve had it so long (I bought the iOS and macOS apps) that I’m a plus member. Somewhere inbetween premium and free, so that I get syncing and cloud storage. It’s always been a really well designed app and for about 2 years, or so, I journalled every day in it about our lives. I look back at them now and enjoy reading the small snippets of our life. The seemingly (at the time) nothing of note entries and fun and nostalgic to read again. I also realised that so much that went on, I have completely forgotten about. We have annual albums that my wife makes and prints out, so we “remember” events but the every day, it’s gone. I did try and restart it a few times and always felt the pressure of the missing days and thinking I should somehow go back and fill them in - which of course I couldn’t even if I tried. So I’m trying to continue that but also not sweat about missing a day or week here and there. I do want to print out the previous long run in a book for the family to enjoy, and then perhaps make it a periodic thing of printing it out.
I did wonder whether our family journal was enough. I do have my online notes, wiki style stuff, which I’ve found useful having over time, but that’s not quite the same. I’m still considering where I keep that and aggolmerating all the disperate note systems together but that’s for another evening. I’ve had a blog in some form for about 10 years. There’s probably 2 decent posts, some noise and a lot of new themes. I started asking myself “why do I want a blog?”. I asked why five times. I’m not sure I liked the answer, and tried to think of a different one to give but that was even harder. Why didn’t I like the answer? Well, it starts with I don’t like social media - I don’t like the companies, I don’t like what it does to people, and I particularly don’t like how it impacts our children. As I was answer the questions, my answers were sounding like I wanted social media. I wanted to share things because I wanted interaction, recognition, I wanted others to enjoy what I wrote. But does this mean my actions and motives are encourging social media?
Up to now, my personal blogs have been standalone websites, I have no idea if anyone ever looks at them (I’ve had maybe one comment and one email in the past 5 years) and I was fine with that as I’d carved out my space on the internet and it wasn’t being controlled or controlling anyone. One of the reasons why I barely wrote anything was because I had no motivation, because there was no interaction. (Ironically, I’d prefer CDN hosted static sites as I was worried about what would happy if “a lot of people” visited it and a php or python server on a cheap VPS would be overwhelmed). I’m not sure micro.blog is exactly what I want, but seems like a reasonable middle ground. I do worry that I start scrolling the discover feed and realise an hour has gone by - exactly the behavour I want to avoid, but hopefully I can find a suitable middle ground once I work out how best to use it.
Mostly I hope the site will let me take action vs. a whole bunch of motion. Plus as a tight git 💷, the subscription should hold me accountable 😅